How to Use AI to Analyze CRM Data (HubSpot, Zoho, Salesforce, Pipedrive)
I loaded 3,000 closed leads from a B2B SaaS-style CRM export and let AI analyze them with real statistical tools — no spreadsheet wrestling. Here's which leads actually convert, what drives lead scores, and how to run the same AI lead scoring analysis on your own HubSpot or Salesforce export in 15 minutes.
Quick answer
To analyze CRM data with AI, export your leads to CSV (HubSpot, Zoho, Salesforce and Pipedrive all support this), connect your AI assistant to an analytics engine such as the open source meelu-analytics-mcp server, and ask questions in plain English — the engine runs real statistical tests instead of letting the model guess. In our 3,000-lead demo, demo attendance was the strongest predictor of a closed deal, faster response time beat lead source by a wide margin, and the whole analysis took about 15 minutes. If you just want to spot the deals your forecast counts but your team's notes say are dead, our free lead sentiment analyzer scores a CRM export in the browser, no setup needed.
Every sales team asks the same questions of its CRM and rarely gets straight answers: which leads actually convert? Does answering faster really matter? Which sources are worth the spend? Where does follow-up effort go to die? The data to answer all of that usually sits right there in a lead export — it just takes hours of pivot tables to extract, so nobody does.
I wanted to see whether AI could do that extraction properly. The setup: a CRM export of 3,000 closed leads (won or lost), shaped like a typical B2B SaaS pipeline — the usual columns: lead source, industry, company size, deal size, hours to first response, touchpoints, whether a demo happened, email opens, region, and rep. I connected Claude to a small open-source analytics tool (the meelu analytics server) that runs real statistics and trains real models on the data, loaded the CSV, and asked questions in plain English.
A quick honesty note: the dataset is a realistic demo export I built to mirror a typical B2B SaaS pipeline, so I could publish everything without leaking real customer data. The analysis, models, statistical tests, and every number below are completely real — produced by the tools, not guessed by the AI. The workflow is exactly what you'd run on your own export; the last section shows how.
The baseline: 706 of 3,000 leads converted — a 23.5% win rate. Now, the questions.
Which leads are most likely to convert?
I asked Claude to train a prediction model on the 3,000 leads and then to tell me, in ranked order, what the model actually leaned on.
The answer was almost embarrassing in its clarity:
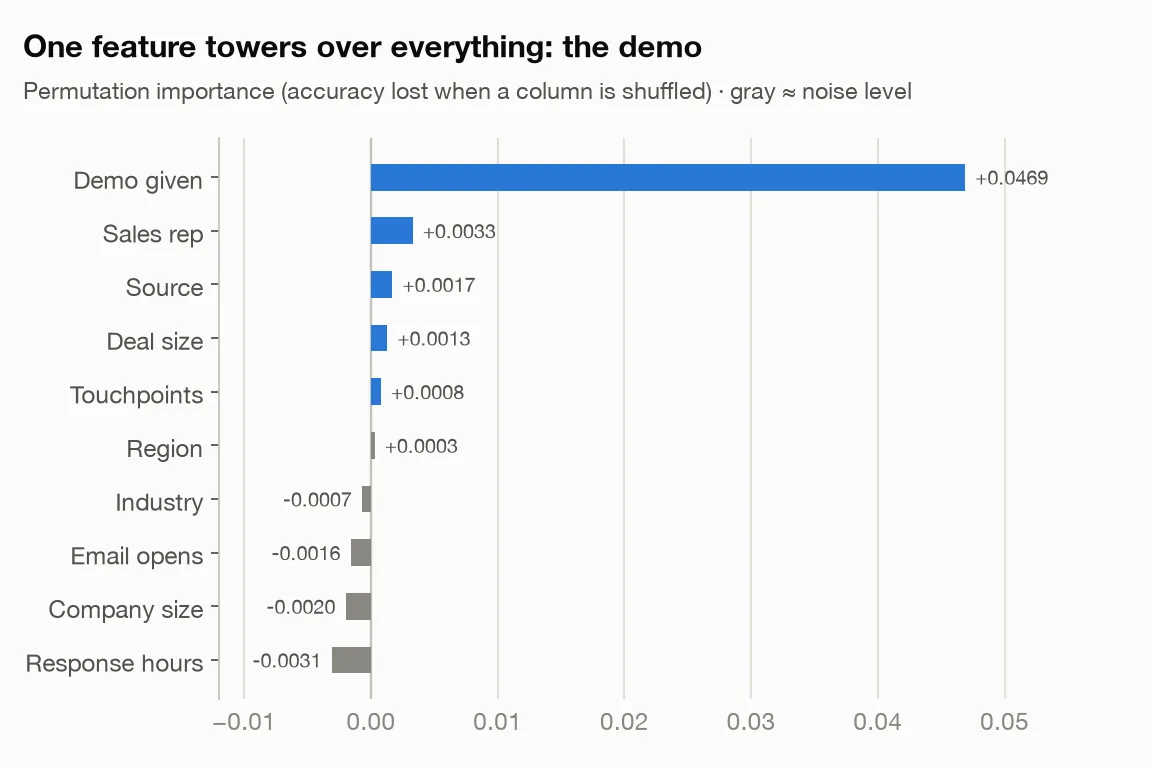
Whether a demo happened matters roughly 14 times more than the next best signal.
The raw rates back it up: leads that got a demo converted 45.4% of the time; leads that didn't converted 12.3%. That's a 3.7x gap, from 1,016 demo leads vs. 1,984 no-demo leads.
A second, independent analysis attributed 74% of the explainable variation to the demo, 16% to lead source, and 10% to response time. Its single best "hot lead" rule: warm source + demo + first response under ~16 hours.
One caveat the tool itself attached, which I'll repeat because it's the trap everyone falls into: importance shows what the model relied on, not what causes the win. Demos may partly be a symptom of an already-interested buyer, not just a cure for a hesitant one. More on that honesty below.
Does responding to leads faster actually increase conversion?
This one's a sales cliché — "speed to lead" — so I wanted the actual numbers from this dataset.
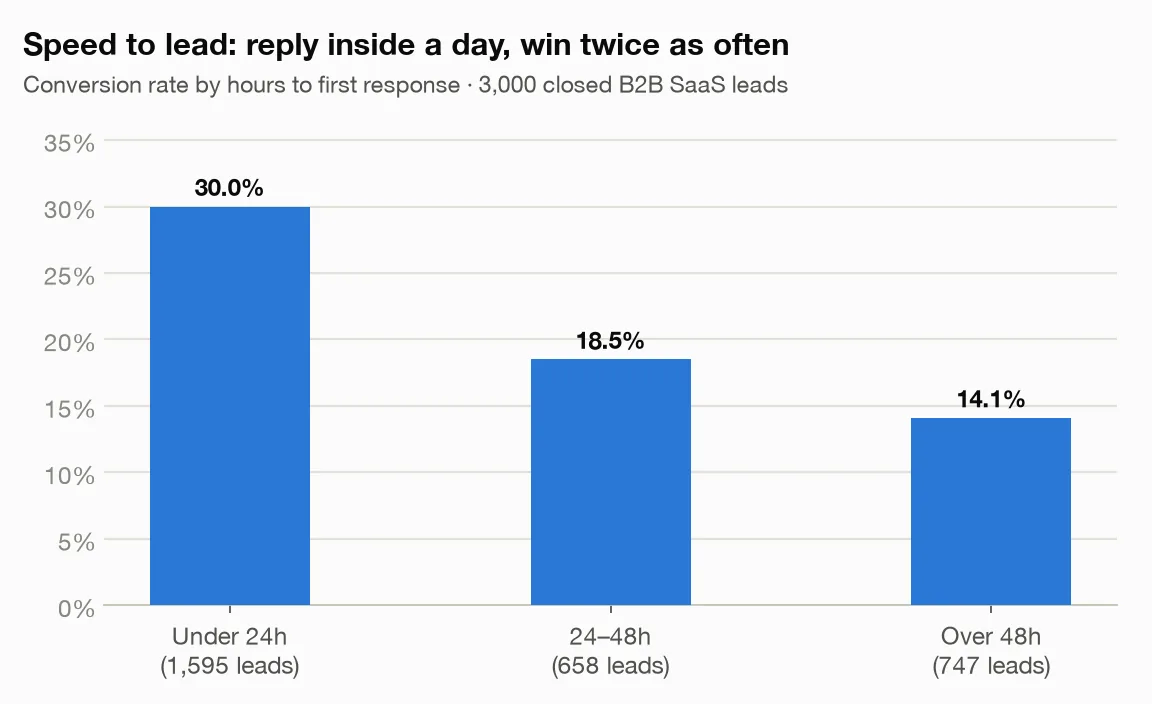
- First response under 24 hours: 30.0% conversion (1,595 leads)
- 24–48 hours: 18.5% (658 leads)
- Over 48 hours: 14.1% (747 leads)
Reply within a day and you win more than twice as often as when a lead waits two days or more. I also had the tool run a proper statistical test rather than trusting my eyeballs: the link is real beyond any reasonable doubt, with a moderate effect size. And it attached its standard warning: association is not causation — fast responses might partly reflect hotter leads getting prioritized. Fair. But a 30% vs. 14% split is worth a service-level agreement on first response either way.
Which lead sources are worth the money?
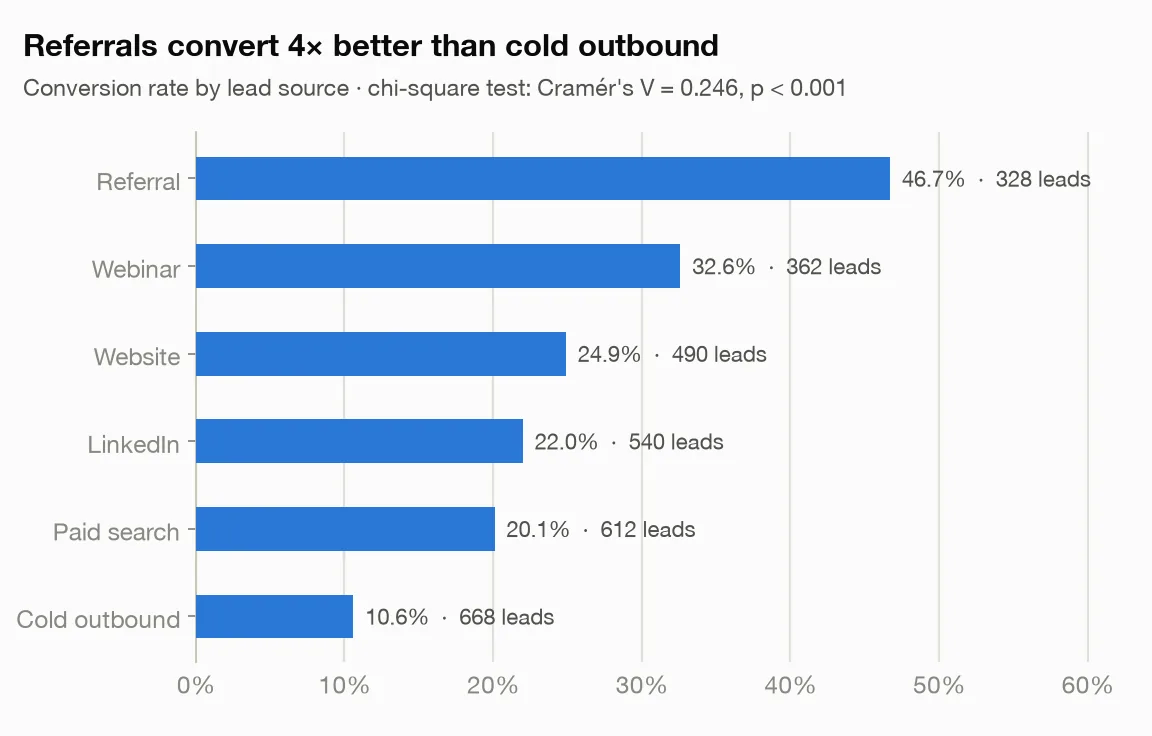
| Source | Leads | Conversion |
|---|---|---|
| Referral | 328 | 46.7% |
| Webinar | 362 | 32.6% |
| Website | 490 | 24.9% |
| 540 | 22.0% | |
| Paid search | 612 | 20.1% |
| Cold outbound | 668 | 10.6% |
A referral converts 4.4x more often than a cold outbound lead. The statistical test on source vs. outcome came back as the strongest link in the whole dataset. Meanwhile cold outbound is the single biggest bucket of leads (668) with the worst return. A team looking at these numbers should be asking what one systematic referral-generation program would be worth versus the next cold sequence.
Company size told a quieter version of the same story: mid-size companies (51–200 employees) converted at 29.9%, clearly ahead of every other band (the rest sat between 20.1% and 24.8%). That's an ICP signal hiding in a column most teams never aggregate.
Why do sales teams keep chasing leads that never close?
My favorite finding, because it's the most actionable. I split leads by number of touchpoints — calls, emails, follow-ups — and by whether a demo ever happened:
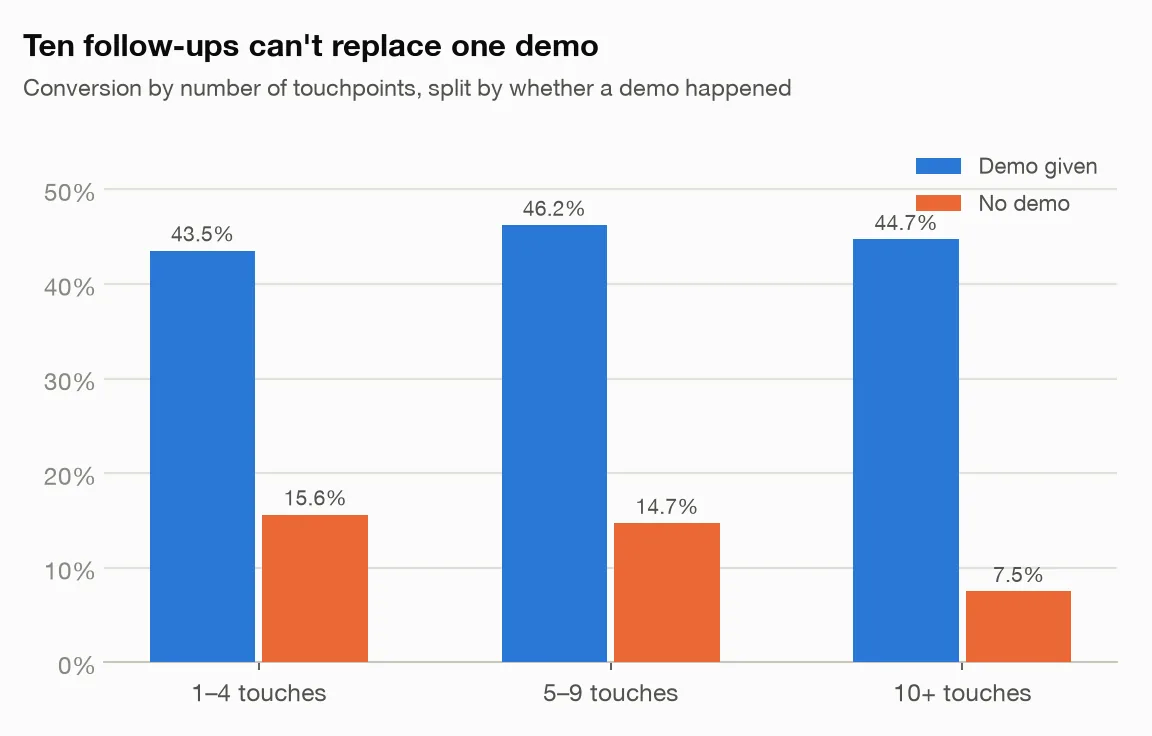
With a demo, more touches are fine — conversion holds between 43.5% and 46.2% regardless of touch count. Without a demo, the line falls off a cliff: leads that got 10 or more touches but never a demo closed just 7.5% of the time — the worst cell in the entire analysis, and there were 683 such leads. That's 683 leads' worth of calls and emails spent on deals that were, statistically, already dead.
The operational translation: volume of follow-up is not a substitute for advancing the sale. If a lead won't take a demo after a handful of touches, the data says stop dialing and requalify.
Which sales reps are actually performing?
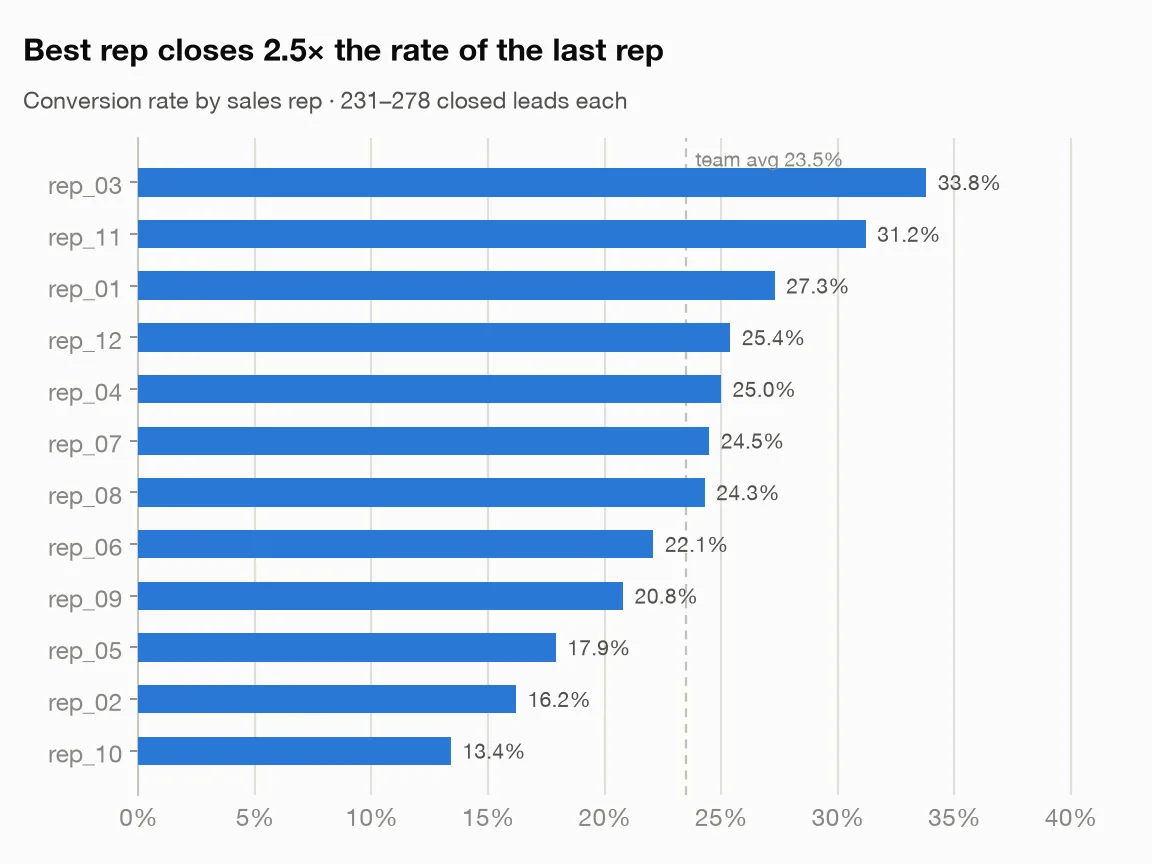
Twelve reps, each with 231–278 closed leads — enough volume that the gaps mean something. rep_03 closed 33.8% of leads; rep_10 closed 13.4%. That's a 2.5x spread on comparable lead volumes.
The supporting columns add nuance. rep_05 had the fastest average response time (32.1 hours) and the highest demo rate (38.6%) yet converted only 17.9% — so activity metrics alone don't explain the gap; something in later-stage execution does. The model agreed: even after accounting for source, response time, and demos, "which rep owns the lead" was the second most useful predictor. That's a coaching conversation, not a dashboard curiosity.
Can AI explain why a specific lead will or won't convert?
Averages are nice; deals are individual. The tool can take one lead and break its score into named contributions — an itemized receipt for a prediction.
The hot lead. Lead L100246: a referral from a 51–200-person company, first response in 3.9 hours, demo given, handled by rep_03. The model scored it around 93% to close (it did close).
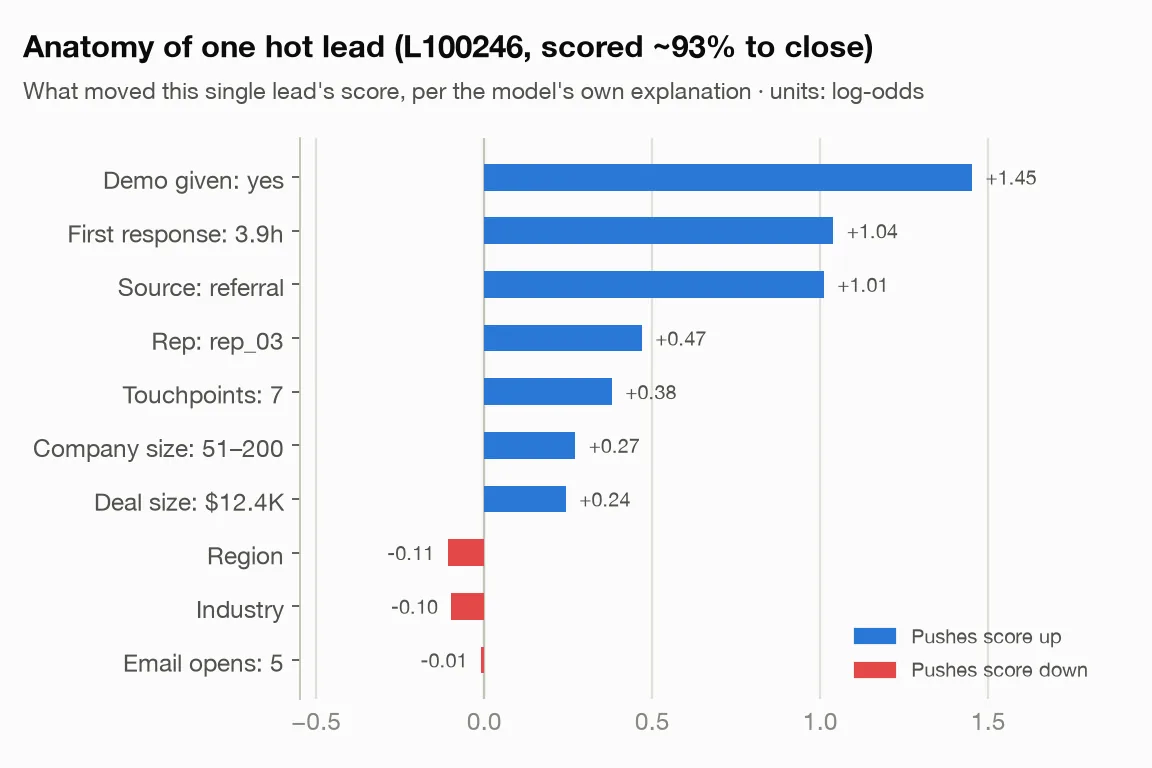
In plain English: this lead scored high mainly because they got a demo (the biggest push by far), someone answered them within four hours, and they came in as a referral. Being rep_03's lead and being mid-size added smaller nudges. Nothing meaningful pushed against it.
The dead lead. Lead L100008: cold outbound to a 1000+ company, first response after 84 hours, 13 touchpoints, no demo. Scored around 7%. The itemized receipt showed the $33K deal size pushing the score up — the model likes big deals — but everything a rep controls pushing down: the pile of demo-less touchpoints, the cold source, the missing demo, the three-and-a-half-day response. It didn't close. Thirteen touches were spent finding that out.
That's the difference between a lead score and a lead explanation. A score says "7%." An explanation says "stop calling; this died at hello."
Can I trust AI-generated analysis of my CRM data?
Here's the part that sold me, and it's not a feature — it's a refusal to have one.
Every result this tool returns carries a trust block: a confidence level (high / moderate / low) plus explicit caveats. And it has a declined flag — when the data can't support a question, it refuses to invent a number rather than hallucinating one.
Contrast that with pasting a spreadsheet into a chatbot and getting a confident, un-caveated, unreproducible answer. Confidence is cheap. Calibrated confidence is the product.
Why not just upload my CRM export to ChatGPT or Claude directly?
Uploading a CSV to a chatbot is one click. Three things make the connected tool better, and all three showed up in this analysis.
1. The chat re-reads your data on every question. A 3,000-row export is a few hundred thousand tokens. A chatbot reads all of it — often truncating silently — then reads it all again for every follow-up. Here the CSV loaded once into a local database. Claude sent small commands ("conversion rate by source") and got back a dozen numbers, not three thousand rows. I asked over a dozen questions and paid the data cost once.
2. Computed answers, not plausible ones. Ask a model reading raw rows for the referral conversion rate twice and you may get 44% and 48%. Every figure in this post came from real computation: a database counted the 46.7%, a trained model produced the separation score. Same question, same answer, every time. And when my clustering came back weak, the tool said so — a chatbot always generates something.
3. Your customer data stays home. The CSV — lead details, deal sizes, rep performance — never left my machine. The AI saw only summaries: "referrals: 328 leads, 46.7%." If your security team winces at "we uploaded our pipeline to a chatbot," this is the answer.
FAQ
What is lead scoring? Lead scoring is a way of ranking leads by how likely they are to buy. Each lead gets a number based on things you know about them — where they came from, company size, how they behaved, how fast you responded — and sales works the high numbers first. Simple versions assign points by hand. Statistical versions learn the weights from your own closed-won and closed-lost history, which is usually more accurate because it reflects what actually converts for you.
What is a good lead conversion rate? Most B2B teams convert somewhere between 1% and 5% of raw leads into customers, and 10-30% of qualified leads into deals. The number swings hard by channel: referrals and inbound demo requests convert several times better than cold list purchases or paid display. Because the range is so wide, your own baseline matters more than any benchmark — measure conversion per source, then compare sources against each other rather than against an industry average.
What is the difference between an MQL and an SQL? An MQL (marketing qualified lead) has shown enough interest for marketing to pass it on; an SQL (sales qualified lead) has been accepted by sales as worth working. The handoff between the two is where most pipeline leaks. Tracking the MQL-to-SQL acceptance rate tells you whether marketing is sending the right leads, and tracking SQL-to-close tells you whether sales is working them well.
Why do leads go cold? Slow follow-up is the most common reason. Response time matters more than almost anything else you control: leads contacted within minutes are far more likely to convert than leads contacted the next day. The other usual causes are poor fit (the lead was never in your market), no clear next step after first contact, and too few touches before the rep gives up.
Do this with your own CRM data
The setup takes about 15 minutes: export your data as CSV and follow the instructions in the meelu-analytics-mcp README. Then ask your questions in plain English — start with the ones in this post.
Frequently asked questions
How do you calculate lead conversion rate?
Divide the number of leads that became customers by the total number of leads, then multiply by 100. If 3,000 leads produced 180 customers, that is 6%. Measure it over a window long enough to cover your sales cycle, otherwise recent leads that have not had time to close will drag the number down. Break it out by source and by owner as well as overall, because the blended figure hides the differences that are worth acting on.
What data do you need for lead scoring?
You need closed outcomes — leads you know won or lost — plus whatever you knew about each lead at the time. Useful fields are source or channel, company size and industry, the dates of creation and close, activity counts such as calls and emails, response time, and the owner. Open deals cannot teach a model what winning looks like, so the closed history is the part that matters. A few hundred closed leads is enough for a rough picture; a thousand or more makes a scoring model meaningfully steadier.
How can you improve lead quality?
Start by measuring conversion by source rather than volume by source. Cheap channels that produce lots of leads often produce almost no customers, and cutting them frees budget for the ones that work. After that, the biggest levers are tightening qualification criteria so sales stops working bad-fit leads, and cutting response time so good leads do not go cold while they wait.
This post is part of building Meelu, an AI marketing agent that runs locally — site audits, data analysis, outreach, and social listening on your own machine. Join the waitlist to hear when it ships.
Related posts