How to Use AI to Analyze Google Analytics (GA4) and Search Console Data
I connected Claude to a real statistics engine and analyzed two years of GA4 data plus 600 Search Console queries for a personal-finance site. Here's how AI found the traffic drop, proved it wasn't noise, and surfaced 70,000 potential clicks — without hallucinating a single number.
Quick answer
Export your GA4 and Search Console data to CSV, connect an AI assistant to a statistics engine like meelu-analytics-mcp, and ask it to find trends, changepoints and opportunities. On two years of a demo personal-finance site's data, the analysis pinpointed when the traffic drop started, proved statistically that it wasn't noise, and surfaced queries ranking just off page one worth roughly 70,000 potential clicks — every number from a recorded test, none hallucinated. If you only need the date your traffic changed and what it cost, our free traffic drop analyzer does that from a Search Console or GA4 export in the browser, no setup needed.
Every SEO has lived this morning: you open GA4, organic traffic has fallen off a cliff, and you spend the next three days exporting CSVs, building pivot tables, and arguing with yourself about whether the drop is "real" or just a bad week.
I wanted to know how much of that work an AI can now do — honestly, with real statistics, not vibes. So I built a realistic demo dataset for a personal-finance content site (Roth IRAs, high-yield savings, budgeting), planted the kinds of problems SEOs actually face, and asked Claude to analyze it using a connected statistics engine that runs real tests on the data instead of guessing.
The dataset: 730 days of GA4-style traffic (September 2024 through August 2026) and 600 Search Console queries from the last three months. Because it's a demo, I know the ground truth — a fair test of whether the AI finds what's actually there. Every number below comes from an actual tool run, not from the model's imagination. At the end I'll show you how to run the same analysis on your own exports in about ten minutes.
Why did my organic traffic drop?
This is the question that starts every one of these investigations, so I started there too. First, the picture:
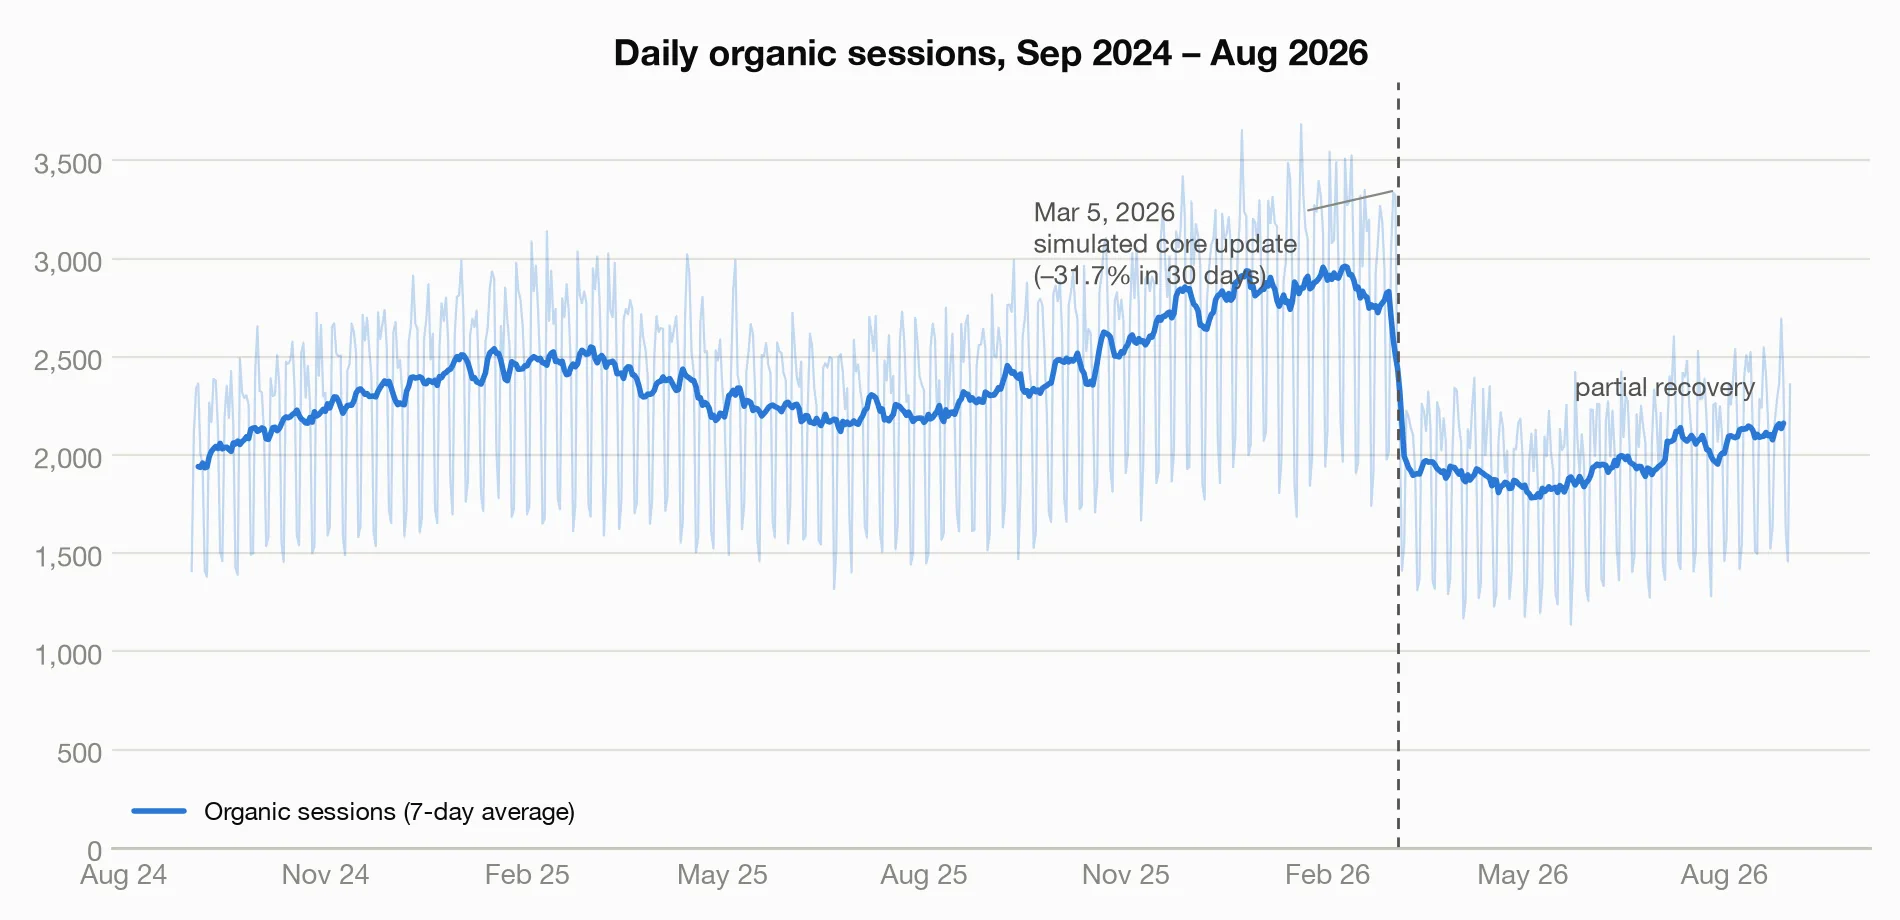
I asked the AI to find where the series breaks. Full disclosure: the dedicated changepoint check declined to run — it needed an optional package that wasn't installed, and instead of quietly making something up, it returned an error saying exactly that. I'll take a tool that says "I can't do this" over one that invents an answer every time.
So we found the break the classic way: scanning the database for the worst week-over-week declines across all two years. The two biggest drops in the entire dataset were back-to-back — the week of March 2, 2026 (−12.0%) and the week of March 9, 2026 (−22.3%). Nothing else in two years comes close (the third-worst week was −6.1%). That pins the break to the first week of March 2026 — exactly where I'd planted a simulated Google core update on March 5.
How do I know the drop is real and not just noise?
This is where most spreadsheet analysis stops and most arguments start. Traffic is noisy, and a bad stretch can look like a crisis. So I had the AI run a formal before/after comparison, splitting the data at March 5, 2026:
- Average daily organic sessions before: 2,418
- Average after: 1,957 — a −19.1% change across the whole post-period
- A standard statistical test that checks whether the drop could be random noise put the odds of that at effectively zero — this is real, not a bad week
- A second, independent test on the full shape of the data agreed
- And the drop isn't just real — it's large, not a subtle shift
Zooming into a tight window makes the cliff more visible: the 30 days before the update averaged 2,865 sessions/day; the 30 days after averaged 1,958 — a −31.7% collapse. Daily conversions fell with it, from about 80/day in February to 60/day in the month after.
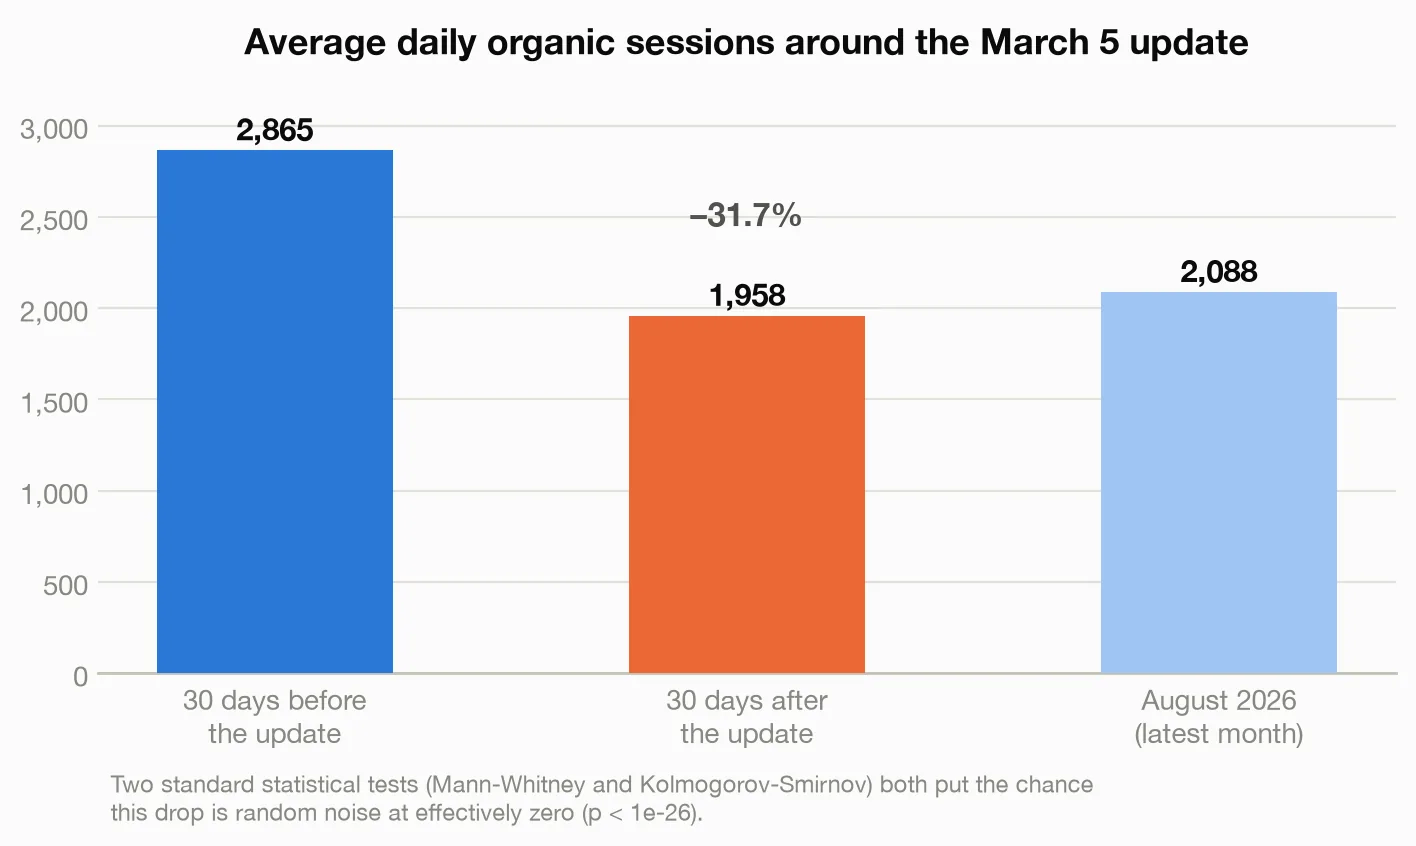
Two honesty notes, straight from the tool's own output. It rated this result moderate confidence, not high — 180 post-update days is "reasonable but not definitive." And it flagged that a before/after comparison is not proof of cause: "something other than time (seasonality, a promo, a mix shift) could explain the change." That's exactly the caveat a good analyst would give you, and most AI chat tools won't.
Did the traffic recover after the core update?
Partially. August 2026, the most recent full month, averaged 2,089 sessions/day — up from the post-update floor of ~1,958, but still well below the ~2,865/day the site was doing before the hit. That's roughly 73% of the pre-update level. (Caveat I'd add myself: late summer is seasonally softer for finance content in this dataset, so the "true" recovery is probably slightly better than that number looks.)
Stripping out the day-to-day noise makes both stories obvious — nearly 18 months of slow, steady growth, then a cliff, then a slow climb back:
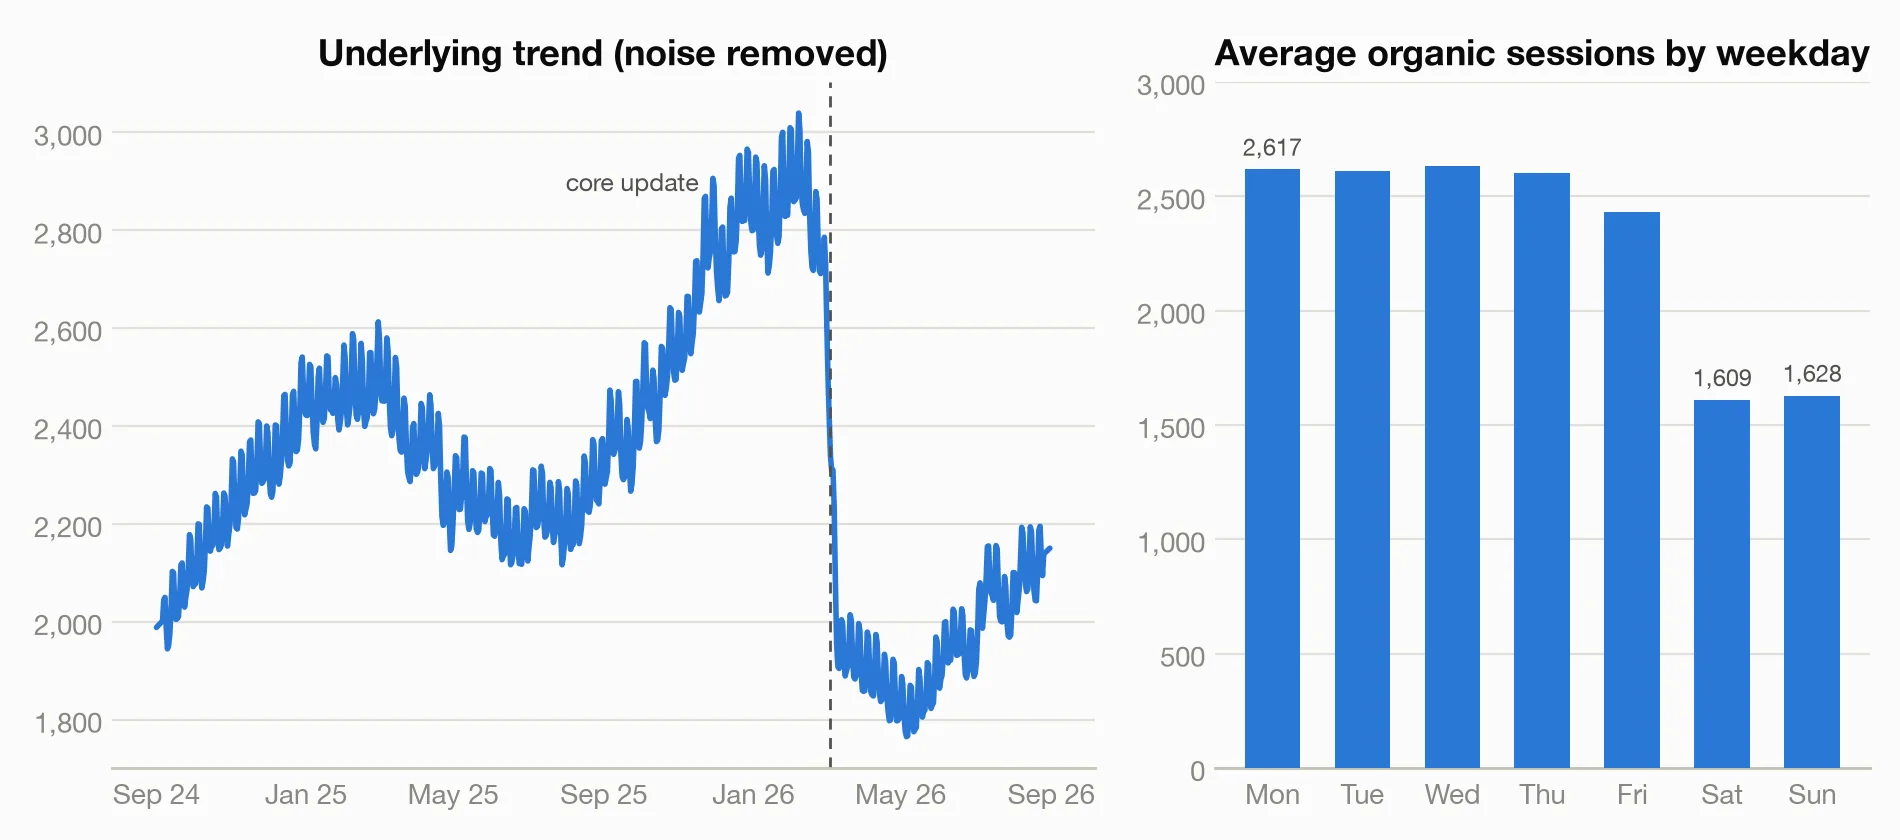
Splitting the series into trend + repeating pattern + noise also confirmed the second thing I'd planted: a hard weekly rhythm. Weekdays average ~2,600 organic sessions; Saturdays and Sundays average ~1,610–1,630 — weekends run about 37% below weekdays. People read about 401(k)s at their desks, apparently. This matters practically: never judge a traffic change by comparing a Tuesday to a Sunday, and always compare full weeks to full weeks.
One honest footnote: the trend-splitting tool auto-picked its own seasonal window rather than the 7-day cycle I expected, so I verified the weekly pattern separately with a direct day-of-week query. The numbers above come from that query.
Which page lost the most traffic?
Aggregate numbers tell you that you were hit; page-level data tells you where. One query against the Search Console table settled it. The site's high-yield savings account page — historically a top performer — is now the worst-performing page on the site by clicks, despite still having one of the largest impression pools:
| Page | Clicks (3 mo) | Impressions | Median position |
|---|---|---|---|
| /blog/50-30-20-budget | 13,090 | 104,484 | 6.0 |
| /blog/side-hustles-that-pay | 10,714 | 138,784 | 9.3 |
| … 12 other pages … | 3,400–9,500 | 80K–169K | 6.9–11.2 |
| /blog/best-high-yield-savings-accounts | 1,569 | 113,922 | 28.9 |
Read that last row again: 113,922 impressions — second-most on the site — and only 1,569 clicks, because its median ranking collapsed to position 28.9 (page three of Google). Every comparable page sits at median position 6–11. Google still shows the page constantly; nobody scrolls far enough to click it. That's the signature of a page that lost rankings in an update, not a page that lost demand — and it's exactly the page I'd planted as the update's victim.
How much does ranking position actually affect click-through rate?
Before estimating any "opportunity," I wanted the position–CTR relationship proven on this site's own data, not borrowed from an industry study. The AI tested it across all 600 queries:
- The link is about as close to perfect as real-ish data gets — the further down you rank, the lower your CTR, with almost no exceptions across 600 queries — statistically proven, not noise
- The tool rated this high confidence, while still reminding me that correlation isn't causation
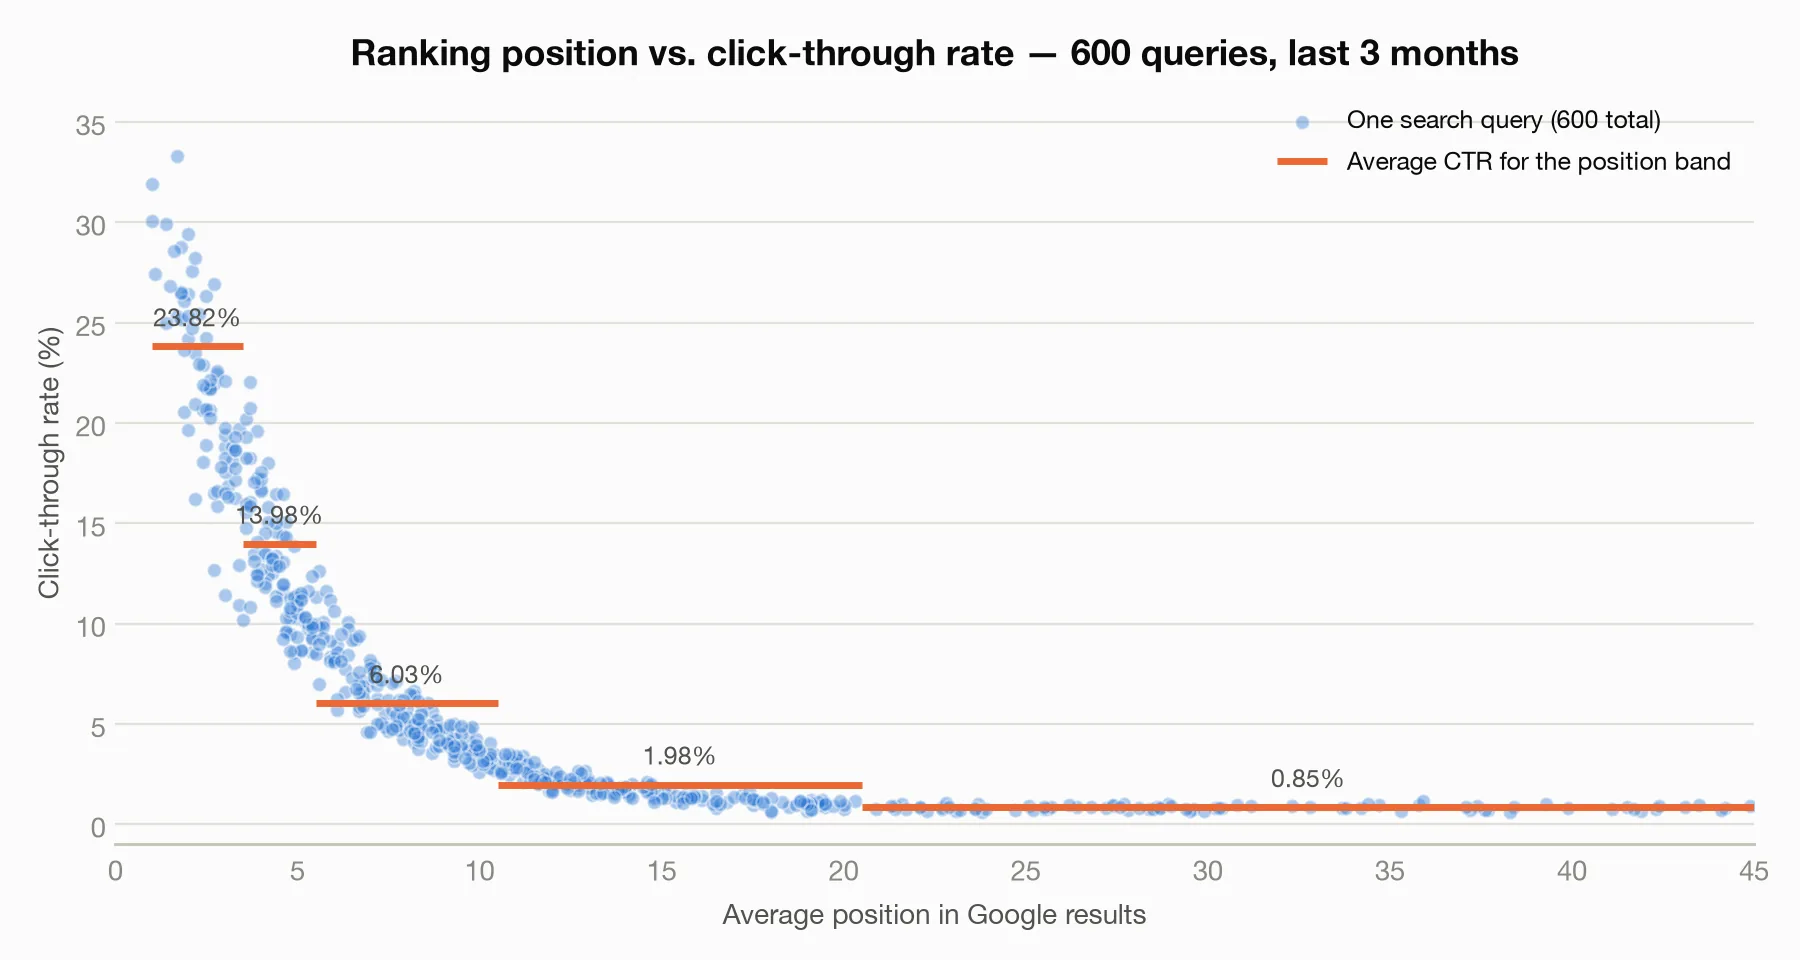
The banded averages, computed from this dataset, are brutal and familiar:
| Position | CTR |
|---|---|
| 1–3 | 23.8% |
| 4–5 | 14.0% |
| 6–10 | 6.0% |
| 11–20 | 2.0% |
| 21+ | 0.9% |
Falling from position 3 to position 12 doesn't cost you a third of your clicks. It costs you roughly 90% of them.
How do I find keyword opportunities in Search Console?
Here's the flip side of that cliff: it works in reverse. Queries ranked 8–15 — "striking distance" — need to climb only a few spots to multiply their clicks.
I had the AI query for exactly that: position between 8 and 15, at least 5,000 impressions in the last three months. It found 37 queries. Together they earned 14,567 clicks on 506,517 impressions — a blended CTR of just 2.9%.
Then the estimate: this site's own top-5 rankings earn a median CTR of 16.7%. If those 37 queries reached that CTR, they'd earn about 70,000 additional clicks per quarter — nearly six times what they get today.
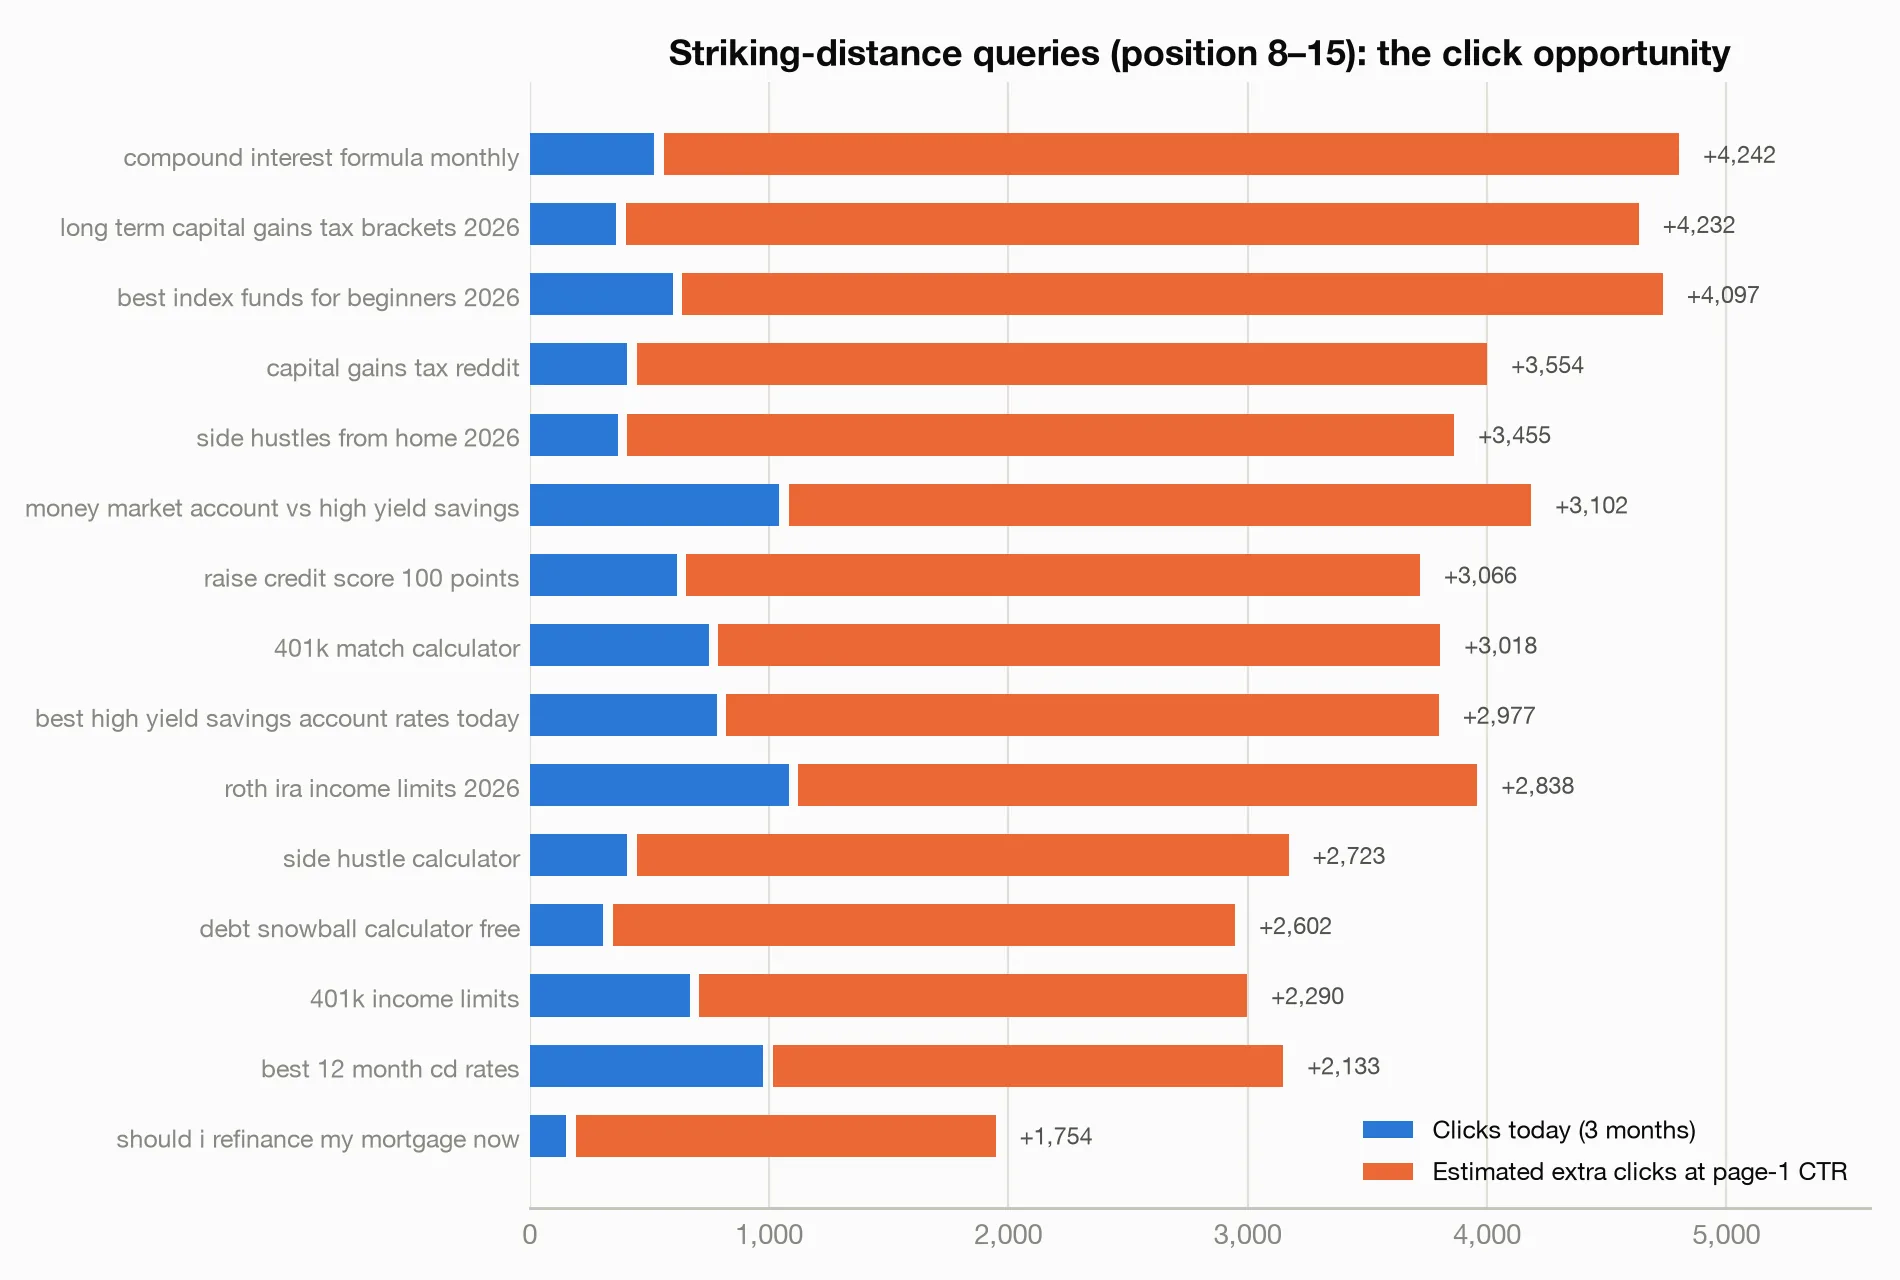
The top of the list is a content brief that writes itself: "compound interest formula monthly" (position 12.4, 28,469 impressions, 1.8% CTR — +4,242 potential clicks), "long term capital gains tax brackets 2026" (+4,232), "best index funds for beginners 2026" (+4,097). These are existing pages that need better title tags, fresher content, and internal links — not new pages.
Treat the 70,000 as a ceiling, not a promise. It assumes every query reaches top-5 CTR, which won't happen. Even a quarter of it would transform this site's traffic.
Can AI forecast my organic traffic?
Yes — and this was the most instructive honesty lesson of the whole exercise. The forecasting tool projected the series forward from its own history, 60 days ahead:
- Central forecast: ~2,085 organic sessions/day through September–October 2026 — essentially "the recovery holds at its current level"
- Realistic range at day 60: roughly 990 to 3,180 sessions/day
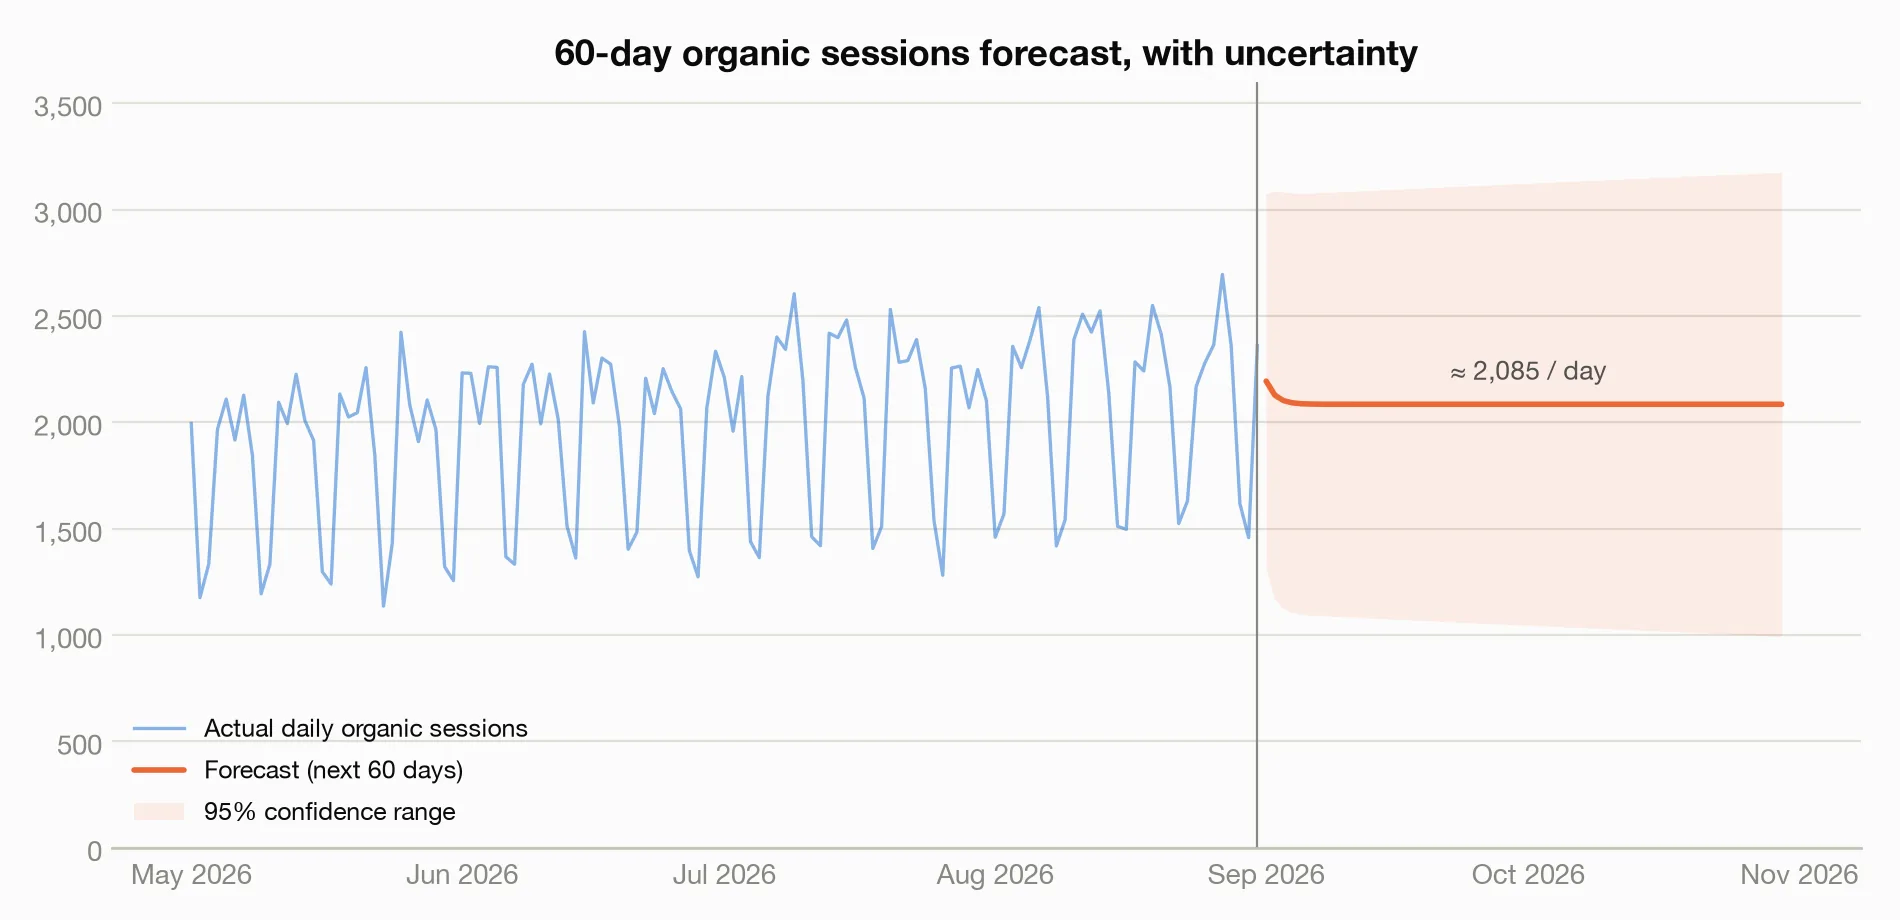
Look at that shaded band. It's wide, and the tool is upfront about why: "forecast uncertainty grows the further out you project" and the model "assumes the past pattern continues — a regime change breaks it." The point forecast also flattens into a straight line — this particular model captures the level, not the weekday/weekend zigzag, so it's a tool for planning monthly totals, not predicting next Saturday.
An AI that hands you a suspiciously precise single number for October traffic is lying to you. The honest output is a level plus a widening range of uncertainty — which is exactly what a competent human forecaster would give you too.
Why not just upload my CSV to ChatGPT or Claude?
Pasting a CSV into a chat is one click. Three things make the connected tool better here.
1. Your data doesn't fit in a chat. Two years of daily GA4 traffic plus 600 query rows is tens of thousands of tokens. A chatbot truncates or samples ("here are the first 200 rows…"), so your March drop may never reach the model — and it re-reads the whole file on every follow-up. Here the CSVs loaded once into a local database; the AI sent short commands ("compare the periods around March 5") and got back small summaries. A dozen follow-ups, zero re-uploads.
2. Real code, not guessed arithmetic. A model reading raw rows pattern-matches: "the average dropped about 20%" on one ask, a different number on the next. Here every figure came from code that gives the same answer every time, and each result names its method — the before/after comparison listed its tests and confidence level, the correlation its method and sample size. The changepoint check, missing a dependency, refused and said so rather than fake something plausible.
3. Your data stays home. The raw CSVs never left my machine; only summaries — averages, test outcomes, small tables — reached the AI. If you handle analytics data for clients, that matters.
A chat upload handles a 50-row spreadsheet fine. For real analytics exports, let the AI operate the instruments instead of squinting at raw rows.
What this workflow gets right (and where to stay skeptical)
What impressed me wasn't any single finding — I planted most of them. It was the calibration:
- It found every planted pattern: the early-March break, the ~30% short-term drop, the partial recovery, the weekday/weekend split, the near-perfect position–CTR relationship, the striking-distance cluster, and the one page that quietly lost everything.
- Every result carried a confidence level and caveats. High confidence on the correlation and profile; explicitly moderate on the before/after comparison, with a warning not to treat it as causal proof.
- It declined rather than guessed when a tool couldn't run.
Stay skeptical anyway: a before/after test can't prove Google caused your drop (check for tracking changes, redesigns, and seasonality first), opportunity estimates are ceilings, and forecasts assume no new shocks. The AI does the statistics; the judgment is still your job.
FAQ
What is the difference between GA4 and Google Search Console? Search Console shows what happens in Google search results — impressions, clicks, average position, and the queries people typed. GA4 shows what happens after someone lands on your site — sessions, pages viewed, conversions, and where the traffic came from. Search Console is the only source for query data, and GA4 is the only source for on-site behavior, so diagnosing a traffic change usually needs both.
What is a good click-through rate in Search Console? It depends almost entirely on position. Results in the top three positions typically get 20-30% of clicks, positions 4-10 get single digits, and anything on page two is usually under 2%. That means a low site-wide CTR is often a ranking problem, not a title problem. The useful check is to compare a page's CTR against the normal rate for the position it holds — underperforming there points at the title and description.
How do you tell if a traffic drop was a Google core update? Look for three things together: the drop is larger than normal week-to-week variation, its start date lines up with a confirmed update rollout, and Search Console shows position losses concentrated on particular pages or topics while impressions hold up. If positions are steady and clicks fell, the cause is more likely seasonality, a tracking change, or a SERP feature taking clicks. Always rule out broken analytics tags before blaming the algorithm.
What is a striking distance keyword? A striking distance keyword is a query you already rank for at roughly positions 8-15 — the bottom of page one or the top of page two. Because click-through rate falls off sharply with position, moving one of these up a few places produces far more traffic than winning a brand new keyword from nothing. They are usually the cheapest wins available, since the page already has some authority for the term.
Do this with your own GA4 and Search Console data
The setup takes about 15 minutes: export your data as CSV and follow the instructions in the meelu-analytics-mcp README. Then ask your questions in plain English — start with the ones in this post.
Frequently asked questions
Why is GA4 traffic different from Search Console clicks?
The two tools count different things, so the numbers never match exactly. Search Console counts a click when someone leaves a Google result page for your site; GA4 counts a session only if its tag actually fires, which ad blockers, consent banners, quick back-clicks, and redirects can prevent. Search Console also covers organic Google only, while GA4 covers every channel. A gap of 10-20% between them is normal; a sudden widening of that gap usually means a tracking problem.
How do you find which pages lost traffic?
Compare two date ranges page by page in Search Console and sort by the largest drop in clicks, then check whether impressions or position fell alongside. If position dropped, it is a ranking issue on that page or topic. If position held and impressions fell, demand or the search results layout changed. If both held and clicks fell, look at the title and description, or at a new SERP feature answering the query above your result.
How much traffic data do you need before a trend is real?
Enough to separate the change from normal variation, which usually means several weeks of daily data either side of the point you care about. A single bad week is rarely a trend — most sites swing 10-20% week to week for no interesting reason. Compare like with like: same days of the week, and account for seasonality by looking at the same period in previous years where you have it.
This post is part of building Meelu, an AI marketing agent that runs locally — site audits, data analysis, outreach, and social listening on your own machine. Join the waitlist to hear when it ships.
Related posts