Can ChatGPT or Claude Analyze CSV Files? Chatbot Uploads vs. a Real Analytics Engine
We asked the same 5 questions of a 3,000-row CRM dataset two ways: an AI reading the raw CSV with no tools, and an AI driving a real analytics engine. Here are the exact answers, the errors, and the token bill.
Quick answer
Yes — ChatGPT and Claude can read an uploaded CSV, but beyond small samples they summarize and estimate rather than compute, and can produce plausible-looking wrong numbers. We asked the same five questions of a 3,000-row dataset both ways: the raw-upload answers contained errors, while the same AI driving a real analytics engine (a local database plus recorded statistical tests) returned exact, reproducible numbers at a fraction of the token cost. If the answer matters, connect the AI to an engine instead of pasting the data into the chat.
Type "can ChatGPT analyze my CSV" into a search box and you get two kinds of answers: breathless yes-it-can posts, and horror stories about invented numbers. Neither tells you what actually happens inside the model, or how to measure it.
So I measured it. I ran the same experiment on Claude twice — once with the meelu-analytics MCP server connected, once with nothing but the raw file. Same dataset, same five questions, two paths:
- Path A — the engine. Claude drives a local analytics MCP server (meelu-analytics) that loads the CSV into a real database and runs SQL and statistical tests. The model never sees the raw rows; it sees query results.
- Path B — raw reading. Claude reads the raw CSV text directly into its context — no tools, no code, no SQL — and answers the same questions by looking at the rows. This is the same thing that happens inside any chat upload the moment the model answers from the file's text instead of running code: on a pasted table, on a follow-up where the tool never fires, or whenever the model decides it can "just see" the answer.
One integrity rule for this post: everything below is something I actually ran. No invented ChatGPT transcripts, no strawman outputs. I had Claude commit its raw-reading answers before checking them against the engine, and I report them as committed — including the ones that came out embarrassingly close, and the one that came out wrong.
What was the dataset and what were the questions?
The dataset is a CRM export: crm_leads.csv, 3,000 B2B leads, 13 columns (source, industry, company size, deal size, hours to first response, touchpoints, demo given, email opens, region, rep, converted). On disk it is 244,658 bytes.
Five questions, in increasing order of difficulty:
- What's the overall lead conversion rate?
- What's the conversion rate by lead source?
- Do converted leads have bigger deals than lost ones?
- Is response time associated with conversion — and how strong is that statistically?
- Which single factor most drives conversion?
For the raw-reading path Claude read 400 of the 3,000 rows (rows 1–400). That's an honest limitation worth stating up front: raw reading starts with sampling whether you like it or not. The full file is ~61,000 tokens; a model answering casual questions about a large upload is rarely attending to every row, and the bigger the file, the worse this gets. Claude committed its five answers from those 400 rows; then I created a fresh engine session and ran the real numbers.
How did the two paths compare on all five questions?
| # | Question | Engine answer (method, trust) | Raw-reading answer (committed first) | Error |
|---|---|---|---|---|
| 1 | Overall conversion rate | 23.53% (706/3,000, SQL AVG, exact) |
~23.3% (hand-counted 93 of 400 rows ending in ,1) |
−0.3 pp — surprisingly good |
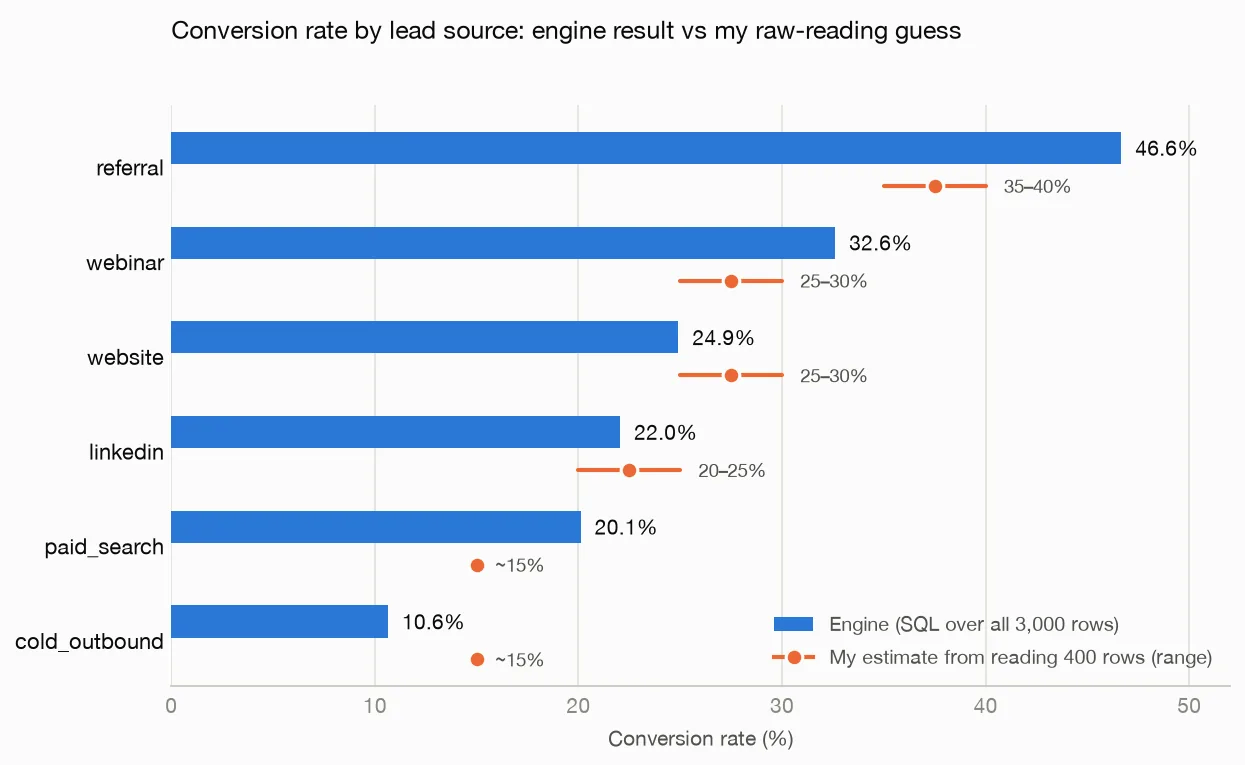
| 2 | Conversion by source | referral 46.7%, webinar 32.6%, website 24.9%, linkedin 22.0%, paid_search 20.1%, cold_outbound 10.6% (SQL group-by, exact) | Ranking impressions: referral ~35–40%, webinar/website ~25–30%, linkedin ~20–25%, paid_search & cold_outbound ~15% | Ranking right; magnitudes off by up to 9.2 pp (referral), cold_outbound off +4.4 pp |
| 3 | Deal size, converted vs lost | Converted $17,440 vs lost $17,443 avg; a recorded statistical test confirms no meaningful difference (high trust) | "Roughly equal, ~$15–17k both; lost maybe slightly higher" | Direction fine, but raw reading can never say "statistically indistinguishable" |
| 4 | Response time vs conversion | A recorded statistical test says the link is real beyond reasonable doubt, but modest in size; medians 14.7h (won) vs 25.0h (lost). High trust. | "Converted cluster at low hours; guess medians ~12h vs ~25h. Strength: cannot compute." | Direction and medians close; the statistical test simply doesn't exist on this path |
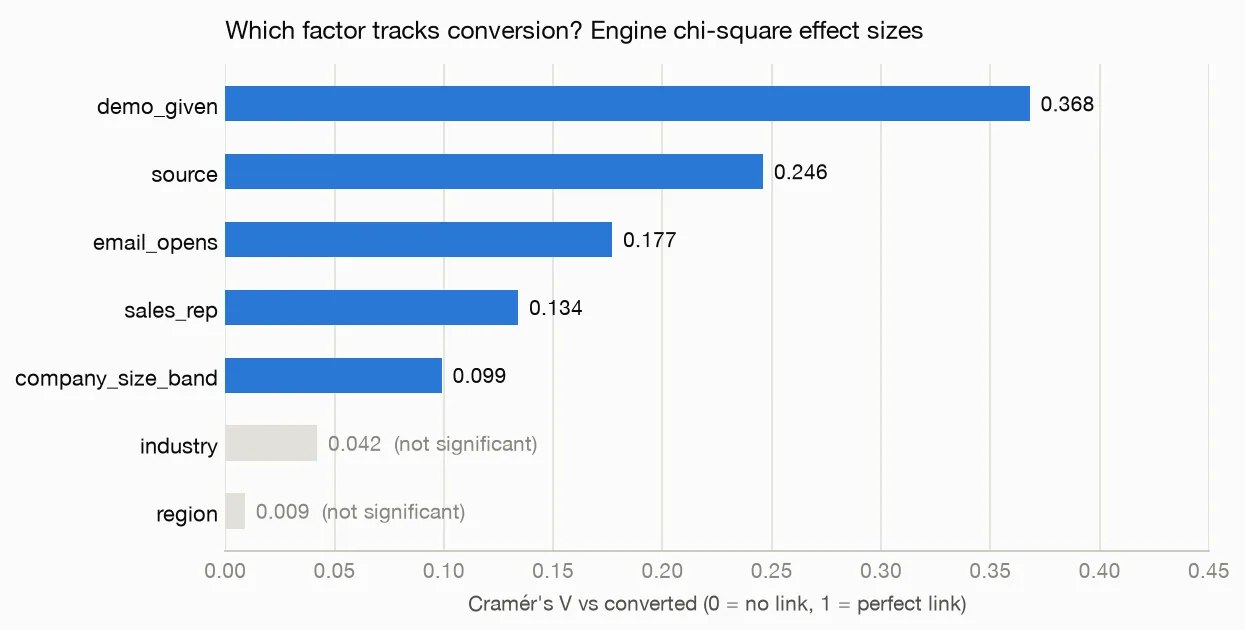
| 5 | Biggest single driver | demo_given by a wide margin, then source, email_opens, sales_rep, company_size. Deal size, region, industry: no measurable effect. | "Response time or referral source" | Wrong. Response time's effect is a fraction of demo_given's |
Here is question 2 drawn out — engine bars against the committed estimates:
And question 5, the one raw reading got wrong. The engine ran a recorded statistical test for every factor against converted and scored each one's strength on the same scale:
Where did raw reading actually hold up?
Honesty over a rigged demo: raw reading did better than the horror stories suggest, on the questions shaped for it.
It survived: counts and eyeballed trends. Claude's hand count of the overall conversion rate landed within 0.3 points of truth. Directional patterns — "referrals convert best, cold outbound worst," "fast responders convert more" — were all correct. If your question is "roughly what's going on here?", a frontier model reading a few hundred rows will often get the gist right.
It degraded: anything requiring arithmetic over groups. The source-level rates kept the right order but drifted by up to 9 points, because the model wasn't computing six numerators and six denominators — it was forming impressions and dressing them in percentages. That's the failure mode that matters: the answer doesn't look wrong. It looks like a number.
It failed: statistical questions. No amount of careful reading produces a real statistical test, a measure of how strong an effect actually is, or the sentence "deal size is not meaningfully different between won and lost leads." On question 5, Claude had a visible pattern (response time) and a plausible story, and it was wrong — the demo flag mattered ten times more. Eyeballs weight what's vivid; a statistical test weights what's there.
There's also a failure mode the table can't show: effort. Counting 400 line-endings by hand is exactly the kind of tedious, error-prone work models are bad at and silently approximate. Claude's two counting passes over different chunks (below) both took real care and still can't be trusted the way SUM(converted) can.
Does asking twice give the same answer twice?
I ran the conversion-rate query twice on the engine — once in my working session, once in a brand-new session created from the same file:
Session s_DgVexk:  23.53%  (706 / 3,000)
Session s_VGfYnk:  23.53%  (706 / 3,000)
Identical, and it always will be: SQL over the same rows is deterministic. Generated estimates are not — variance is a property of sampling from a model, not a bug you can prompt away. To measure the spread honestly, I had Claude hand-count a second 400-row chunk (rows 2,600–2,999) the same way: 23.75% vs the first chunk's 23.25%. Half a point of drift between two attempts by the same model on the same file, on the easiest question. Both passes happened to bracket the truth this time; nothing guarantees that, and on the harder questions there's no second count to compare — just a differently-worded guess.
What does the CSV actually cost in tokens?
The file is 244,658 bytes. At the usual rough estimate of ~4 characters per token (real tokenizers often do worse on dense numeric CSVs), that's about 61,000 tokens — roughly 31% of a 200k context window, or 48% of a 128k window, consumed before you've asked anything.
The multiplication is what kills you. Chat APIs are stateless: the file in your conversation is re-processed as input on every follow-up question. Ten questions ≈ 612,000 cumulative input tokens for one 240 KB file. The engine path sends a command and receives a result — a few hundred tokens per round trip against a database that holds the data locally. Ten questions cost me roughly 6,500 tokens including session setup and profiling: about 1% of the raw-context bill, with no ceiling on file size.
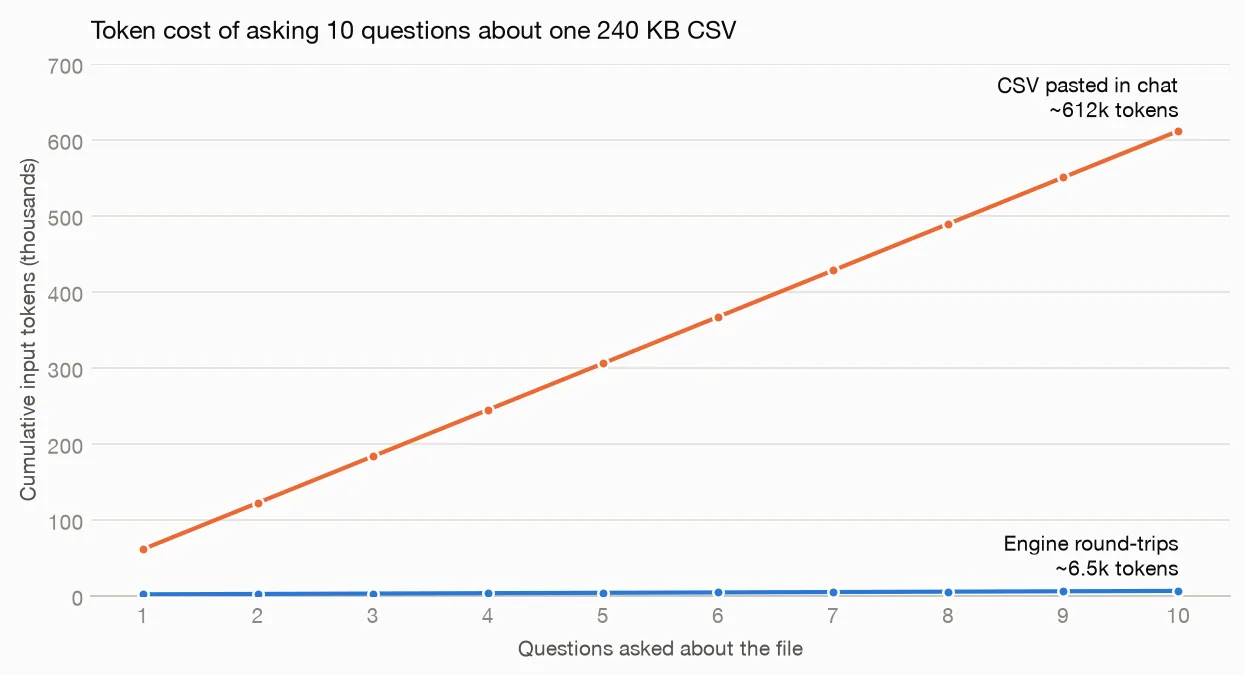
And this file is small. At 30,000 rows instead of 3,000, the raw path stops being expensive and becomes impossible — the file no longer fits in context at all, and whatever the model "read" is a truncated slice it may not tell you about. The engine path doesn't change: COUNT(*) costs the same tokens at 3,000 rows or 3,000,000.
What about privacy?
One asymmetry worth naming plainly: on the engine path, the rows never left this machine. The meelu-analytics server runs locally and reads only from a local directory; what crosses the wire to the model is queries and aggregates — "conversion rate 23.53%," not 3,000 lead records with deal sizes and rep names. Uploading a CRM export to a hosted chatbot sends every row to someone else's infrastructure. For the dataset in this post that's a demo-data shrug; for your actual pipeline it's a conversation with your security team.
FAQ
What is data analysis? Data analysis is the process of turning raw records into answers you can act on. It usually means cleaning the data, summarizing it, comparing groups, testing whether a difference is real, and then explaining what it means. The word covers everything from counting rows in a spreadsheet to fitting a statistical model — what changes is the rigor, not the goal.
Can AI analyze data accurately? Yes, but accuracy depends on whether the AI computes the answer or writes it. When a model runs actual code against the data, the arithmetic is exact and repeatable. When it reads rows and answers from what it remembers of them, it produces fluent numbers that are often close and sometimes flatly wrong, with no way to tell the two apart from the answer alone. The rule of thumb: trust a number you can see the method for.
What kinds of questions can AI answer from a dataset? Counting, ranking, and direction questions are the easy ones — how many, which is biggest, is it going up. Group arithmetic, rates, statistical tests, and anything involving a model are the hard ones, because they require real computation rather than a good guess. The gap matters because both kinds of answer come back sounding equally confident.
Do you need to know statistics or SQL to analyze data with AI? No, though it helps to know which questions are worth asking. You can describe what you want in plain English and let the tool choose the method. What you do need to do is read the caveats: sample size warnings, confidence levels, and the reminder that a correlation is not a cause are the parts people skip and then regret.
How do I run this myself?
The setup takes about 15 minutes: export your data as CSV and follow the instructions in the meelu-analytics-mcp README. Then ask your questions in plain English — start with the ones in this post.
This post is part of building Meelu, an AI marketing agent that runs locally — site audits, data analysis, outreach, and social listening on your own machine. Join the waitlist to hear when it ships.
Related posts