How to Analyze Hotel Booking Data with ChatGPT or Claude
I asked Claude to analyze 4,500 hotel bookings: which reservations will cancel, which channels bleed revenue, and what next season looks like. Real numbers, honest confidence levels, and a step-by-step way to do it with your own PMS data.
Quick answer
Export reservations from your PMS to CSV, connect an AI assistant to an analytics engine like meelu-analytics-mcp, and ask which bookings will cancel and where revenue leaks. On 4,500 demo reservations, the model identified the bookings most likely to cancel and the strongest cancellation drivers, compared revenue across booking channels, and produced a next-season forecast with explicit confidence levels instead of overconfident guesses.
Every hotel's booking data holds the same three questions: which reservations are going to cancel, how much revenue is walking out the door when they do, and what next quarter actually looks like. And anyone who has pasted a spreadsheet into a chatbot has hit the follow-up question: is the AI actually computing the answer — or just making things up?
To find out, I ran the experiment end to end. I took a realistic demo dataset — 4,500 reservations spanning two full years at a mid-size city resort hotel, modeled on the famous public hotel-bookings dataset that researchers have used for years — loaded it into the meelu-analytics MCP server (a local toolkit that lets Claude run real statistics on the actual data), and asked it those questions in plain English.
Every number in this post comes from an actual computation on that data. Nothing below is an AI's guess. That distinction matters more than you might think, and I'll come back to it.
Can AI predict which hotel bookings will cancel?
Yes — with useful accuracy, and it tells you how useful.
I had Claude train a cancellation-prediction model on the bookings — a system that learns thousands of small if-then rules from your booking history and stacks them. The model never saw a quarter of the data during training; that held-back slice of 1,125 bookings is where the scores come from.
The results on those unseen bookings:
- 83.7% accuracy — it called five out of six bookings correctly
- It caught 254 of the 361 bookings that actually canceled (about 70%)
- It raised a false alarm on only 76 of the 764 bookings that showed up (about 10%)
- A separation score (which measures how well the model separates cancelers from non-cancelers — a coin flip would score 0.5) of 0.89 out of 1.0 — strong for this kind of problem
The tool also attached caveats to its own scorecard: these numbers come from one round of test data, and real-world performance on brand-new data can be lower. I appreciate a system that says that unprompted.
What does the model actually look at? I ran a check that scrambles one signal at a time and measures how much the model's accuracy drops without it:
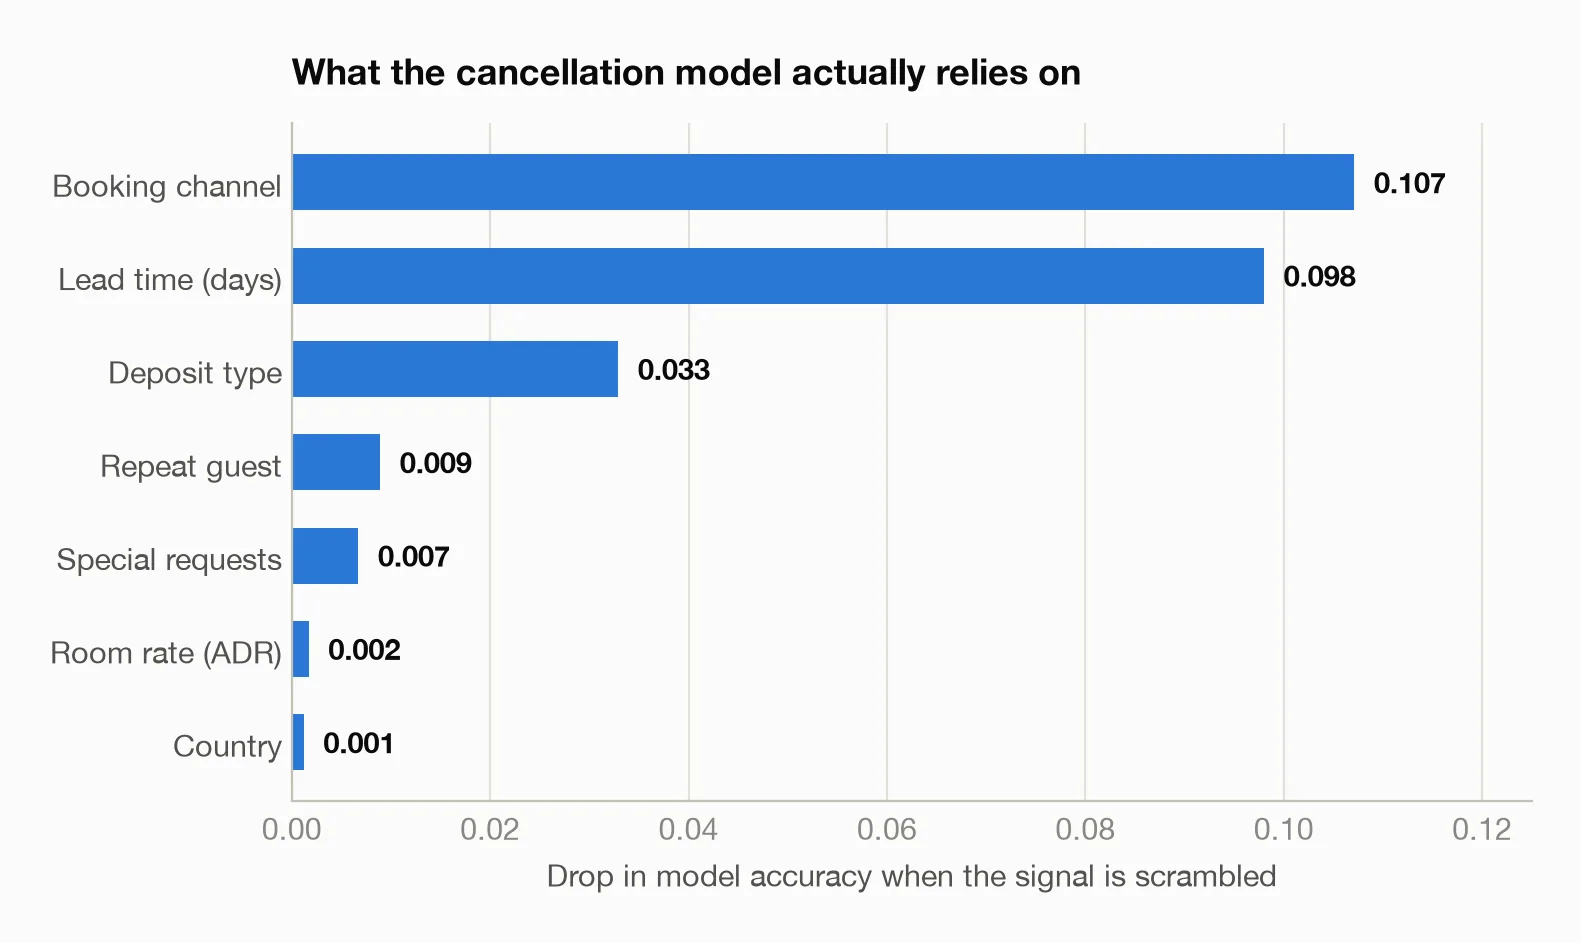
Booking channel and lead time dwarf everything else. Deposit type is a clear third. Room rate, room type, and guest nationality barely register. If you only track two things about a reservation's risk, track where it came from and how far ahead it was booked.
Which booking channels cancel the most?
This was the single loudest finding in the data.
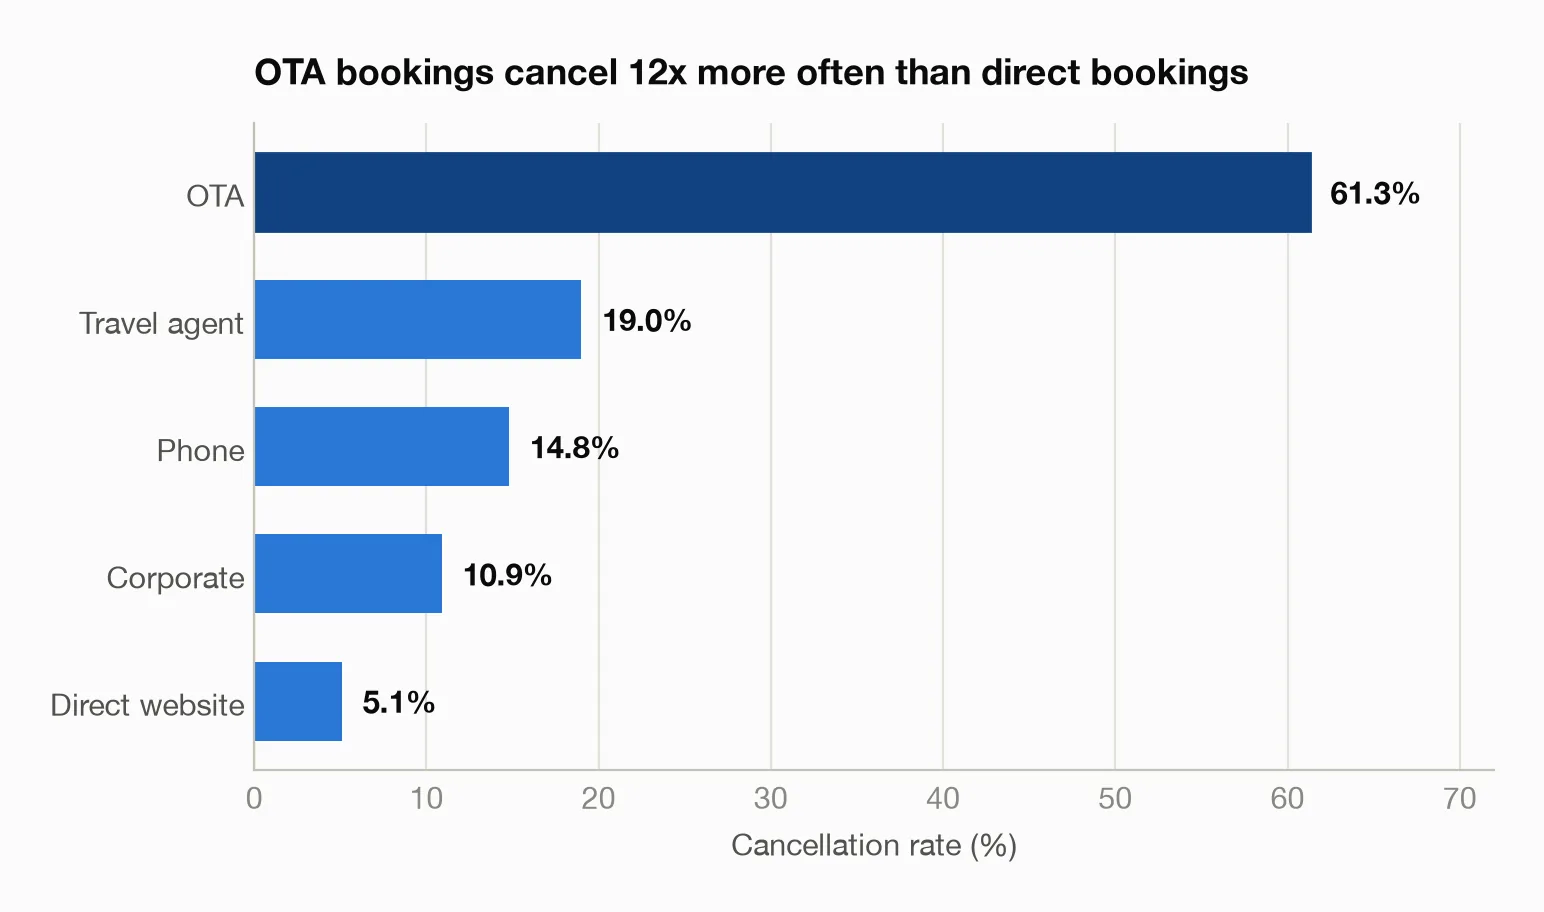
- OTA bookings: 61.3% canceled (1,922 bookings)
- Travel agents: 19.0%
- Phone: 14.8%
- Corporate: 10.9%
- Direct website: 5.1% (1,138 bookings)
A guest who books through an online travel agency was twelve times more likely to cancel than one who booked on the hotel's own website. The math behind this confirmed the link is real beyond any reasonable doubt — the strongest in the dataset, not noise — with the honest reminder that association isn't causation. OTA guests aren't worse people; OTAs make it effortless to book three hotels and keep one.
The overall cancellation rate across all 4,500 bookings was 32.1% — right in line with what the public hotel-bookings research dataset shows for real hotels.
Does booking lead time affect cancellation rates?
Dramatically. I had the tool slice lead time into five equal-size buckets and compute the cancellation rate in each:
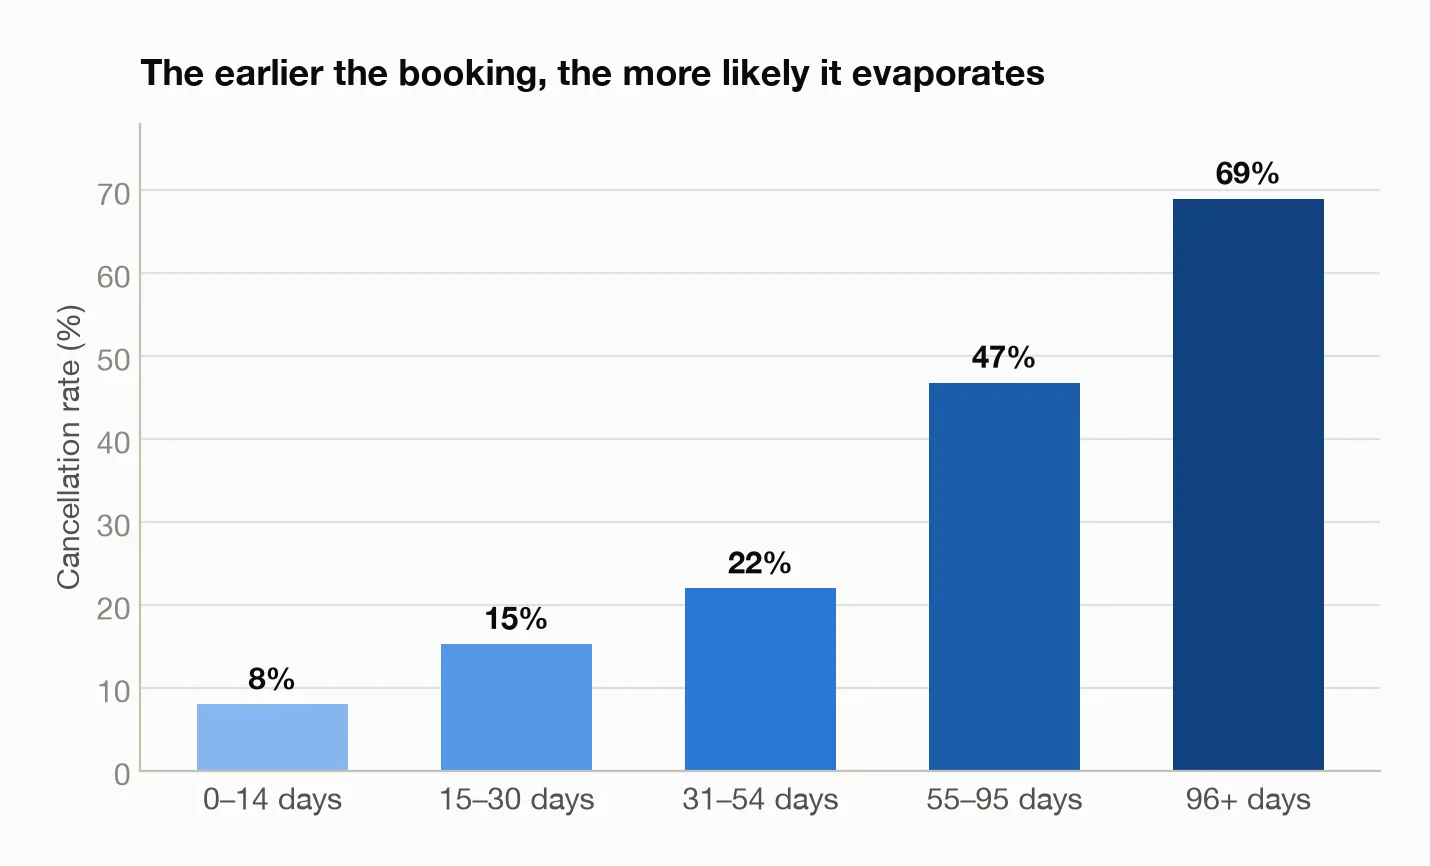
| Booked ahead | Cancellation rate |
|---|---|
| 0–14 days | 8.0% |
| 15–30 days | 15.3% |
| 31–54 days | 22.0% |
| 55–95 days | 46.8% |
| 96+ days | 69.0% |
And the two effects compound. When I asked for human-readable rules that explain cancellations, the tool returned a simple flowchart learned from the data, whose first split was lead time at ~60 days, then deposit type, then channel — and that three-question flowchart alone correctly explains 79% of outcomes. Translated:
Booked more than 60 days out, with no deposit → probably cancels. Booked under 60 days out → probably shows up.
The sharpest version of that rule: OTA bookings made 60+ days in advance canceled 75.1% of the time (1,260 bookings — and yes, three out of four evaporated).
Two happier patterns from the same data:
- Last-minute bookings (under 7 days out) canceled just 2.5% of the time — and paid a 19% higher average nightly rate ($187 vs. $157 overall). Your walk-up-ish demand is premium demand.
- Repeat guests canceled 9.3% of the time vs. 34.4% for first-timers. Guests with special requests on file (early check-in, a crib, a high floor) canceled far less too: 41.5% with zero requests down to 12.1% with four. A guest who's invested in the stay intends to stay.
Do non-refundable deposits reduce cancellations?
In this data, they nearly erase them.
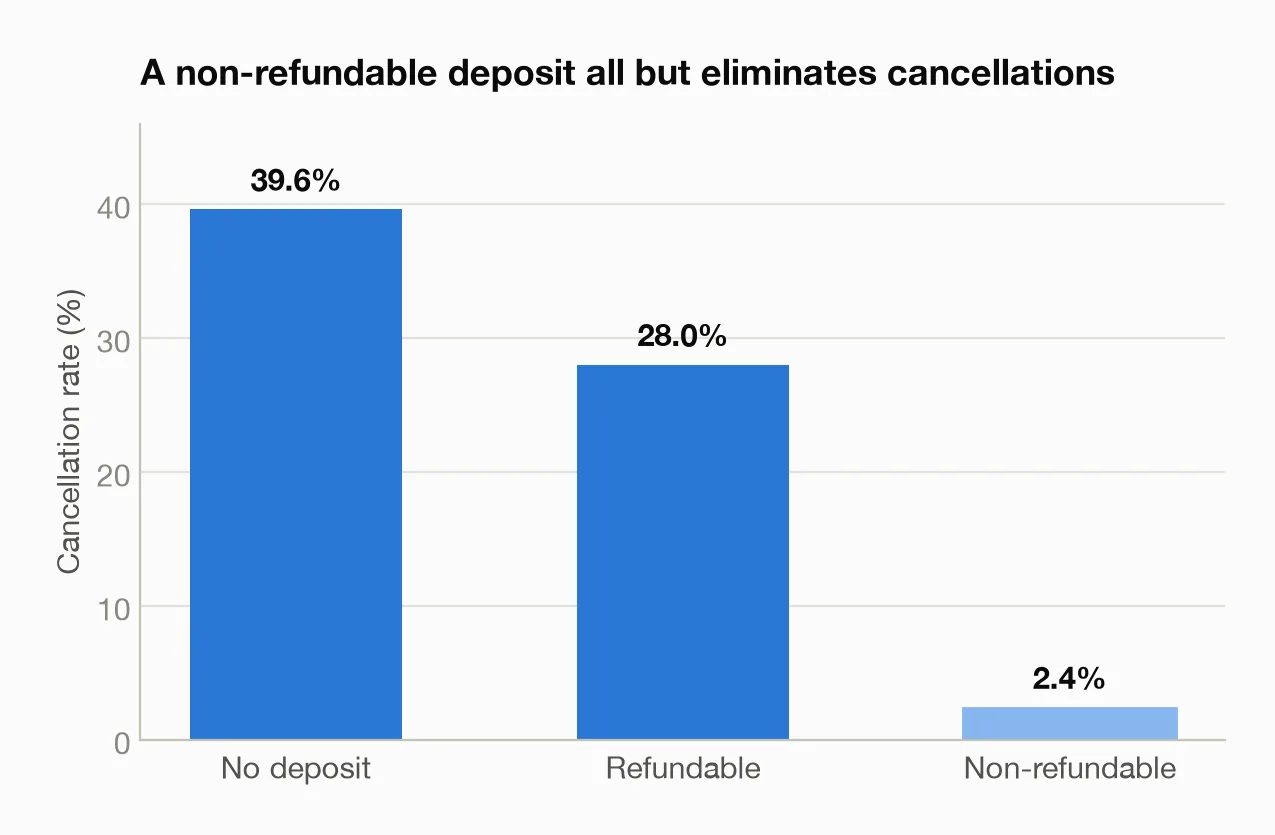
- No deposit: 39.6% canceled
- Refundable deposit: 28.0%
- Non-refundable deposit: 2.4%
The usual caveat applies (guests who choose non-refundable rates are already the committed ones — the deposit doesn't deserve all the credit), and the tool flagged exactly that. But combined with the lead-time finding, the operational play writes itself: you don't need non-refundable rates everywhere. You need them — or at least a partial deposit or a re-confirmation touchpoint — on long-lead OTA bookings, the one segment where the risk lives.
How much revenue do hotel cancellations actually cost?
This is where it stops being academic. I summed room revenue (rate × nights) across the two years:
- Total booked value: $2,405,379
- Value of canceled bookings: $736,482 — almost 31% of everything booked
- Value canceled from the OTA-60+-days segment alone: $479,790
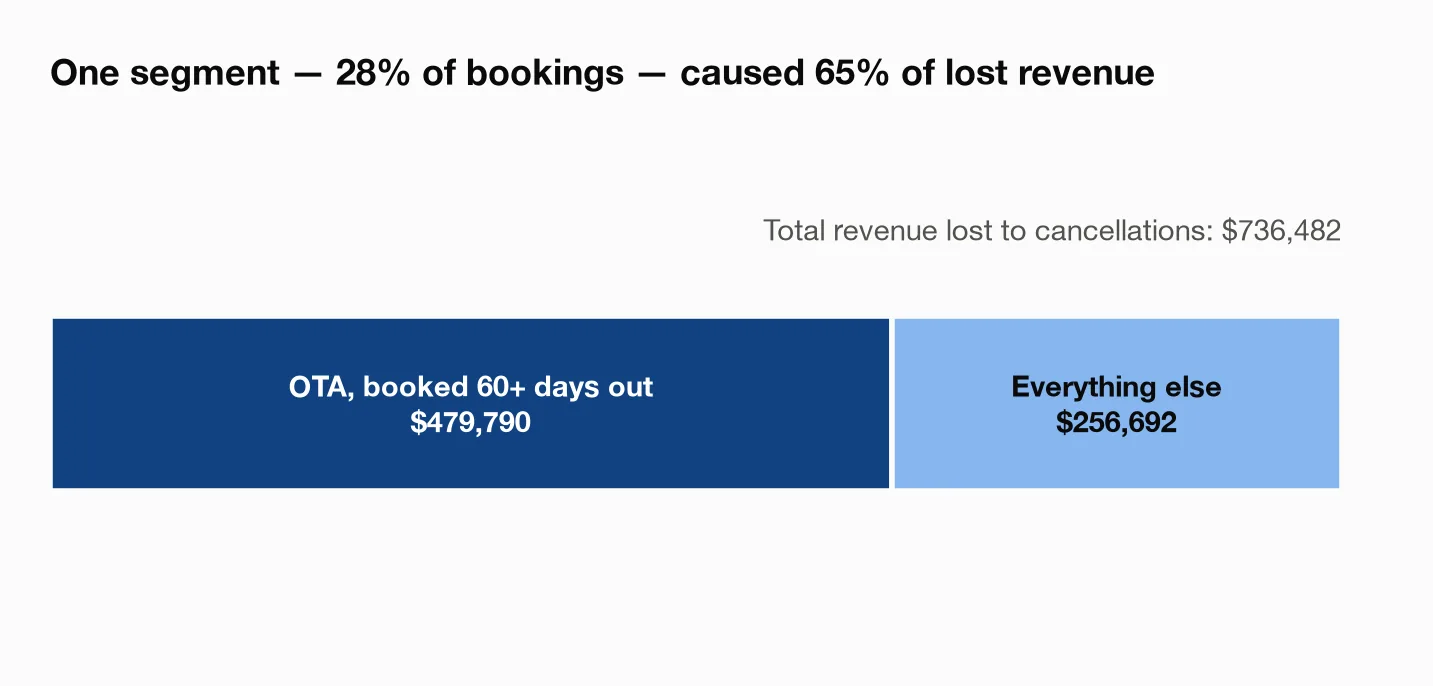
Read that again: a segment that made up 28% of bookings caused 65% of all lost revenue. If this hotel did nothing else but manage that one segment — deposits, re-confirmation emails at day 30 and day 7, or simply overbooking against its known 75% cancel rate — it would be working on nearly half a million dollars of leakage.
For one concrete booking, I asked the model to explain itself. Booking BK104155: an OTA reservation made 222 days ahead, no deposit, zero special requests, first-time guest, $151/night for 3 nights. The model put its show-up chance at roughly one in four, and the explanation — an itemized receipt that splits the prediction into per-factor contributions — read like a risk memo: OTA channel pushed hardest toward cancellation, then the seven-month lead time, then zero special requests and no deposit; the slightly above-average rate nudged faintly the other way. That's a booking a front office could act on today — one flagged as a local, single-booking explanation, not a universal rule, which is exactly the right level of confidence.
Can AI forecast hotel bookings and revenue?
Yes — and this is where the honesty of the tooling earned my trust.
First, splitting the monthly series into its long-term trend, repeating seasonal rhythm, and leftover noise confirmed what the eye suspects: a strong summer wave adding roughly 120–144 bookings per month in July–August above the baseline, a winter trough taking 80–88 away in January–February, and a visible December bump. Both booking volume and nightly rates ride this wave — August averaged $177/night against $128 in January.
Then I asked for a six-month forward forecast, using a forecasting tool that projects a series from its own history:
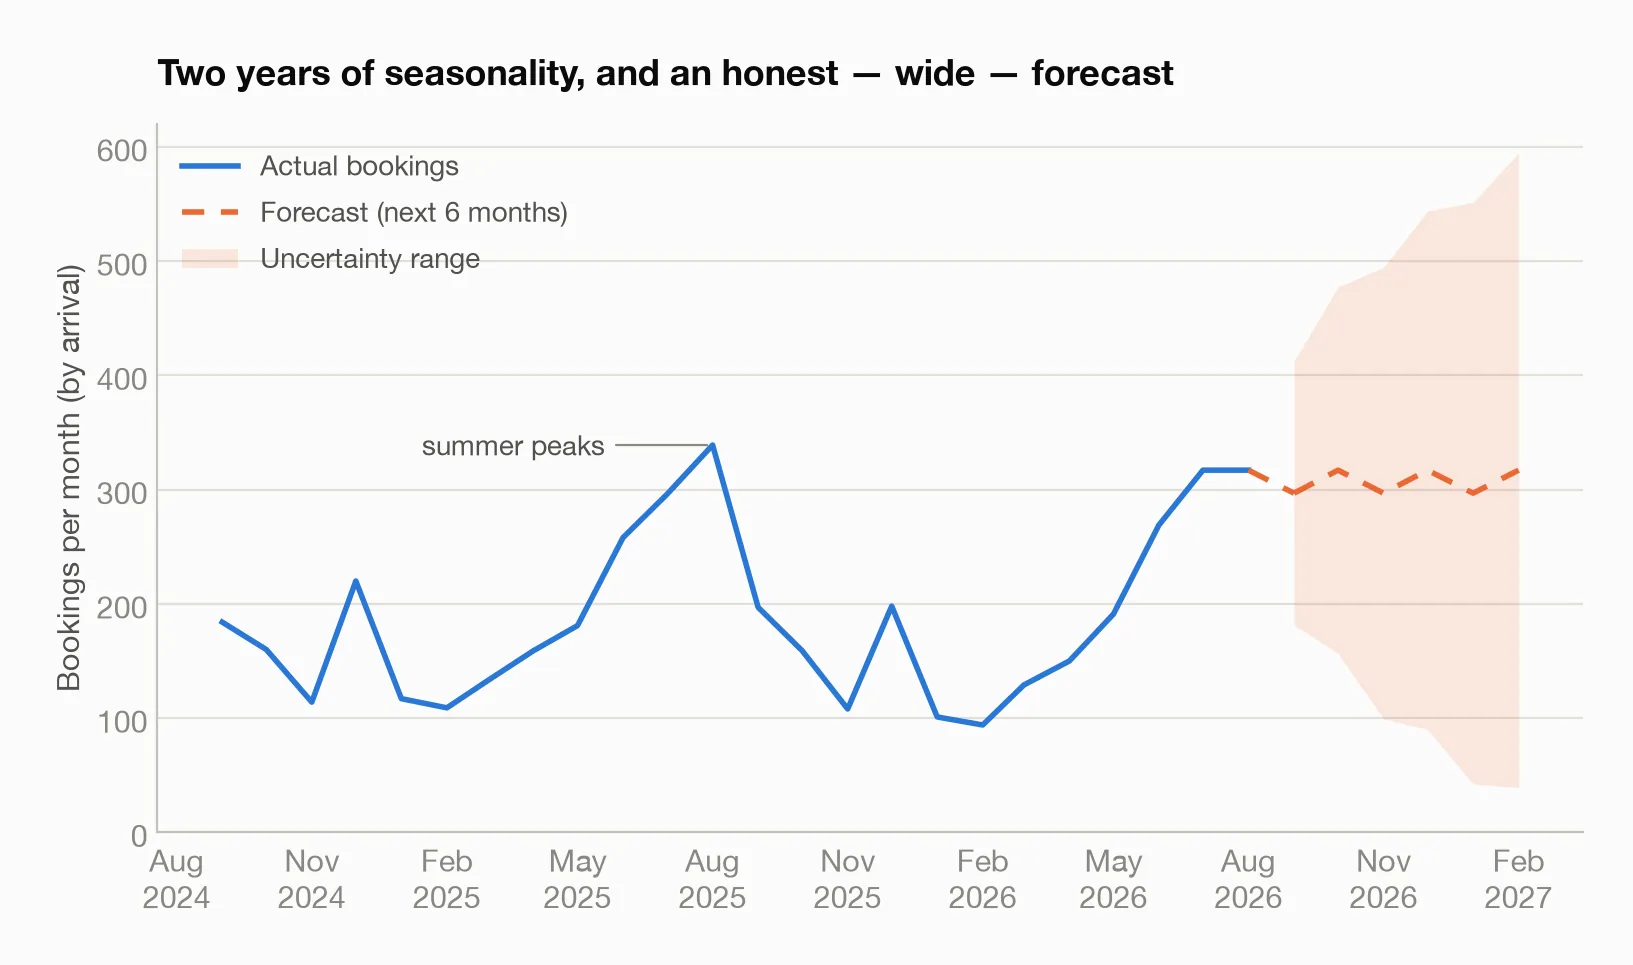
The forecast says roughly 297–317 bookings per month through early 2027, and monthly realized revenue starting around $124,000 for September 2026. But look at that shaded band. The tool rated its own forecast moderate confidence, not high, and said why: only 24 monthly data points — two seasonal cycles — is thin history for a seasonal business, uncertainty grows with every month projected, and the whole exercise assumes the past pattern continues. By month six the plausible range for bookings spans from about 39 to 595.
An over-eager AI would have handed me a single tidy number. This one handed me a range and a reason. For a real hotel, the fix is simple: feed it four or five years of history and the band tightens.
Why not just upload my bookings CSV to ChatGPT or Claude?
Uploading a CSV to a chatbot takes one click. Three things make the connected tool better, and all three showed up on day one.
1. The chat re-reads your file on every question. A 4,500-row booking export is a few hundred thousand tokens. A chatbot reads all of it — often truncating or sampling silently — then reads it all again for every follow-up. Here the CSV loaded once into a local database. Claude sent short commands ("cancellation rate by channel") and got back a handful of numbers, not 4,500 rows. Thirty-plus questions in, nothing had been re-uploaded and nothing was truncated.
2. Computed answers, not plausible ones. Ask a model reading raw rows for the OTA cancellation rate twice and you may get two different figures — these models produce likely text; they don't count. Here the same query on the same table returns 61.3% every time, and each result records the method it chose, a confidence level, and caveats. The tools even refuse to answer when the data can't support the question. Nothing was declined here, but several results came back downgraded to "moderate" trust.
3. Your guest data stays home. The bookings table — names, countries, rates, arrival dates in a real deployment — never left my laptop. The AI saw only aggregates: the cancellation rate, not the guest list. For GDPR or plain guest privacy, that is the easier sentence to say to your compliance person.
What should a hotel actually do with these findings?
The demo data had patterns deliberately planted to mirror what real hotel datasets show, and the analysis recovered every one of them with honest error bars. If your data looks anything like this, the playbook is:
- Score every OTA booking with 60+ days of lead time as high-risk on arrival. In this data that segment canceled at 75% and drove 65% of lost revenue.
- Attach friction to that segment only — partial or non-refundable deposits (2.4% cancel rate here), or a re-confirmation cadence.
- Protect and grow direct booking (5.1% cancel rate) — every booking you shift from OTA to direct is a ~12x reduction in cancellation odds before you spend a dollar.
- Treat special requests as a loyalty signal, not a nuisance — they marked your most committed guests.
- Hold rate for last-minute demand — it paid 19% more and virtually never canceled.
- Forecast with ranges, not points — and feed the model more history to shrink the ranges.
FAQ
What is RevPAR? RevPAR is revenue per available room: room revenue divided by the total number of rooms available over the same period. It combines occupancy and rate into one figure, so it tells you whether the property is actually earning more rather than just filling more beds at a discount. You can also calculate it as occupancy rate multiplied by average daily rate, which gives the same answer.
What is a good hotel occupancy rate? Most hotels aim for 70-80% over the year, and anything sustained above 80% is strong. The right target depends on the property type and market: a city business hotel runs at very different levels midweek and at weekends, and a seasonal resort can be near-full in peak months and half-empty out of season. Occupancy on its own is a weak goal, because it can always be bought with lower rates — judge it next to ADR and RevPAR.
What causes hotel booking cancellations? The strongest single factor is usually how far ahead the booking was made: reservations made months in advance cancel far more often than ones made a few days out. Refundable rates cancel more than non-refundable ones, some distribution channels cancel far more than direct bookings, and bookings with no deposit cancel more than those with one. Part of that is the policy itself and part is who chooses each option, so treat the pattern as a guide to where to test, not as proof of cause.
How do you reduce no-shows and cancellations? Target the segments that actually cancel instead of changing policy across the board. The usual levers are deposits or partial prepayment for high-risk segments, non-refundable rates priced attractively enough that people choose them, confirmation and reminder contact closer to arrival, and tighter control of channels with the worst cancellation records. Test on one segment for a quarter before applying anything property-wide, since stricter terms also suppress bookings.
Do this with your own booking data
The setup takes about 15 minutes: export your data as CSV and follow the instructions in the meelu-analytics-mcp README. Then ask your questions in plain English — start with the ones in this post.
Frequently asked questions
How do you calculate ADR and RevPAR?
ADR (average daily rate) is total room revenue divided by the number of rooms sold. RevPAR is total room revenue divided by the number of rooms available, which is the same as ADR multiplied by occupancy rate. The difference matters: ADR tells you what the rooms you sold went for, RevPAR tells you how well you used the whole building. A rate rise that empties rooms lifts ADR and lowers RevPAR.
What is booking lead time and why does it matter?
Booking lead time is the number of days between when a reservation is made and the arrival date. It matters because it drives two things at once: cancellation risk, which climbs with longer lead times, and pricing strategy, since knowing when your bookings normally arrive tells you when to hold rate and when to discount. A shift in the average lead time is usually an early warning that demand is changing before occupancy shows it.
How far ahead can hotel demand be forecast?
Reliably, a few months; roughly, a year. Forecasts lean on seasonal patterns, so accuracy depends on how many complete seasonal cycles of history you have. Two years of monthly data gives a usable but wide forecast, and three to five years tightens it considerably. No forecast handles one-off events — a conference, a closed motorway, a new competitor opening — so treat it as a baseline to adjust, not an answer.
This post is part of building Meelu, an AI marketing agent that runs locally — site audits, data analysis, outreach, and social listening on your own machine. Join the waitlist to hear when it ships.
Related posts