How to Analyze Google Ads and Meta Ads Data with AI
I let Claude analyze six months of Google and Meta ads data — 3,496 rows — with a local analytics tool. It found creative fatigue, wasted budget, and a tracking outage, and it showed its work. Here's exactly what it found and how to do it with your own CSV export.
Quick answer
Export Google Ads and Meta Ads performance data to CSV, connect an AI assistant to a local analytics engine like meelu-analytics-mcp, and ask where budget is being wasted. On six months of demo data (3,496 rows), the analysis surfaced creative fatigue, wasted spend and a tracking outage — each finding backed by a recorded statistical test, with honest refusals where the data couldn't support an answer. If you just want to know what each channel really returns and how to split the budget, our free marketing mix model does that from weekly spend and revenue in the browser, no setup needed.
Everyone who runs Google or Meta ads ends up asking the same questions: why is my ROAS dropping? Is creative fatigue real or a myth? Which campaigns are quietly wasting money? Answering them honestly usually means a week of CSV exports and pivot tables — which is why they mostly go unanswered. So I ran an experiment: take six months of daily campaign data from Google and Meta for a DTC skincare brand, hand it to Claude connected to a local analytics tool, and ask those questions in plain English.
Quick disclosure: this is a realistic demo dataset, built for this walkthrough. It behaves like the real thing: 19 campaigns, 3,496 campaign-days from March through August, roughly $961K in spend, about 33,500 conversions. Every number below comes from an actual tool result, not from the AI's imagination — that distinction matters, and I'll come back to it.
The whole analysis took about twenty minutes.
How do I analyze Google Ads and Meta data with AI?
The setup is simpler than it sounds. I exported daily campaign data to a CSV (date, platform, campaign, audience type, creative type, creative age, spend, impressions, clicks, conversions, revenue) and loaded it into an analytics tool that runs on my own machine. Claude talks to that tool: it sends small commands ("test whether CTR falls as creatives age"), and the tool runs real statistical code on the data and returns a small, structured answer.
First I had Claude add CTR (clicks ÷ impressions), CPA (spend ÷ conversions), and ROAS (revenue ÷ spend), then profile the table. One detail I liked immediately: 155 campaign-days (4.4%) had zero conversions, so CPA is mathematically undefined there — and the tool left those blank instead of quietly writing in a zero. Small thing, but it's the difference between analysis and vibes.
How do I know if my ad creative is fatigued?
My first question was the one behind most "why is my ROAS dropping?" panics: are the creatives wearing out?
The first pass was a head-fake. Testing creative age against CTR across all campaigns gave a weak negative link — statistically real, not noise, but mushy. The reason is that campaigns have wildly different baseline CTRs — branded search sits near 5%, display near 0.8% — and that noise buries the fatigue signal.
So Claude normalized each day's CTR against that campaign's own average and re-ran the test. Night and day: a strong negative relationship — on this data, creative age lines up with about 42% of the CTR variation.
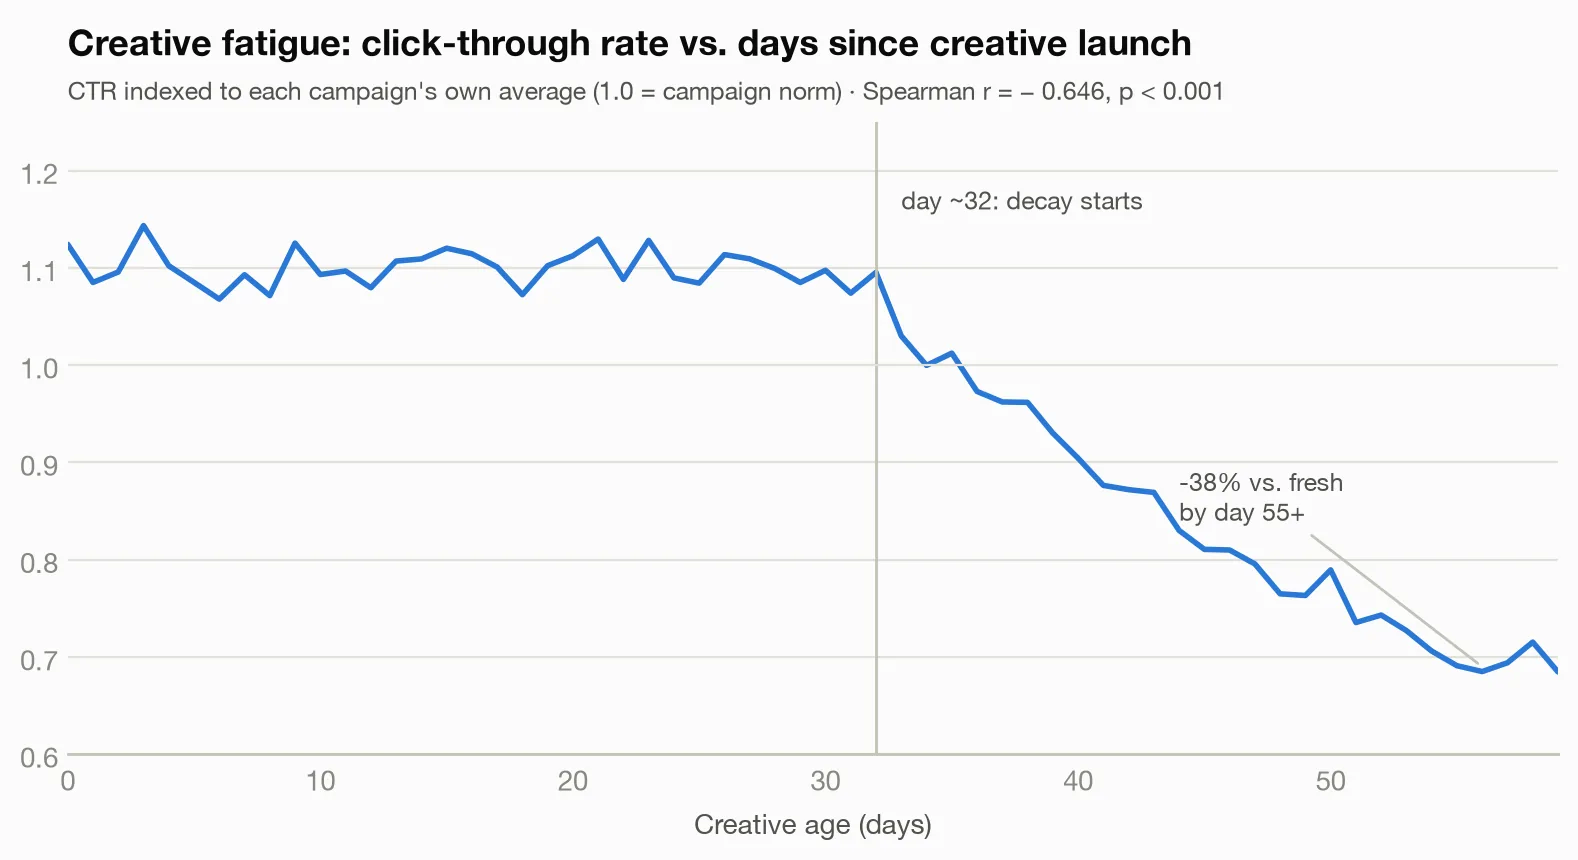
The shape is the actionable part. CTR holds steady — about 7–14% above campaign norm — for the first ~32 days of a creative's life. Then it slides, ending around 31–38% below norm by day 55+. Fatigue here isn't gradual from day one; it's a cliff with a five-week grace period.
The tool attached its own warning to this result, verbatim: "Association is not causation — a third factor or reverse direction could explain it." Fair. But since creative age in this account is set by a refresh calendar, not by performance, I'm comfortable acting on it: refresh creatives on a ~30-day cycle, not the 50–60 day cycles several of these campaigns were running.
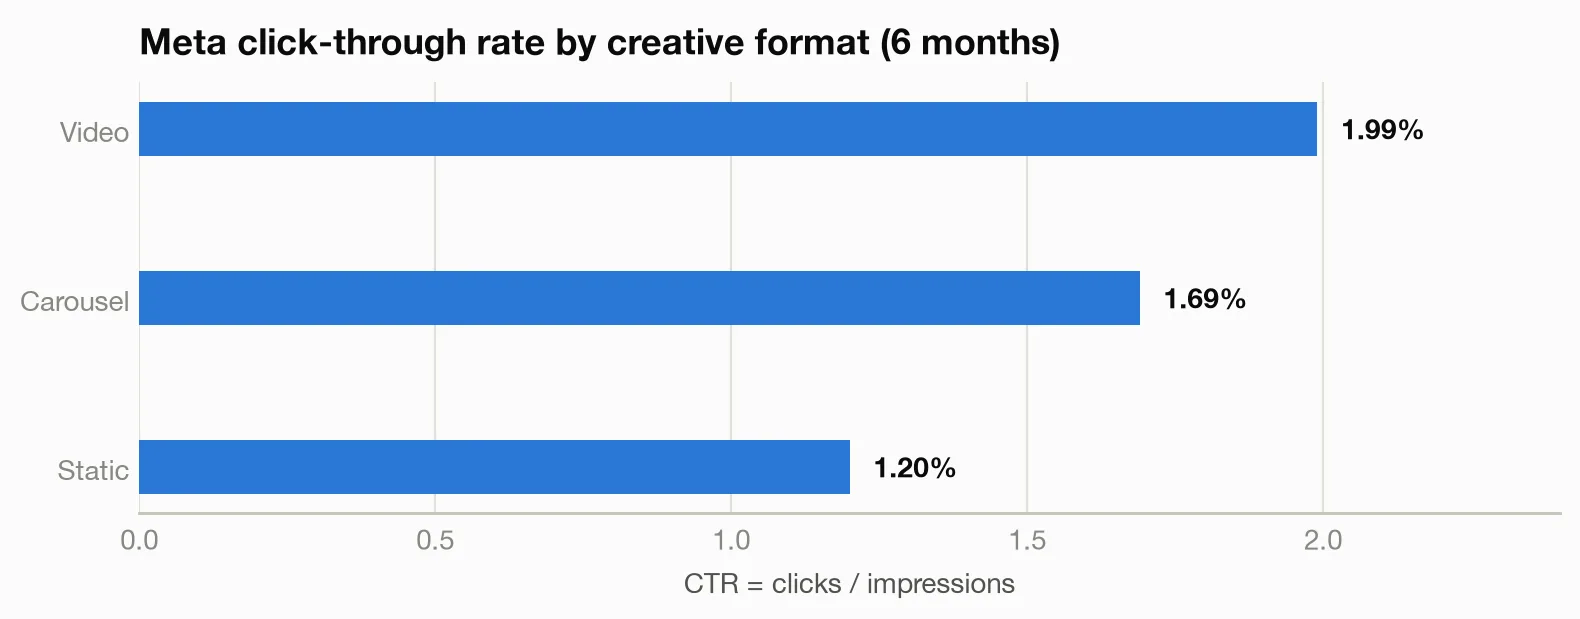
Format matters too. On Meta, video pulled a 1.99% CTR over six months versus 1.20% for static — a 66% gap — with carousel in between at 1.69%.
Which audiences actually make money?
Next: is the retargeting-beats-prospecting gospel true in this account, and by how much?
A standard statistical test for whether groups differ (the tool picked it automatically based on the data's shape) said audience type explains about 56% of the variation in daily CPA — a huge effect, proven beyond any reasonable doubt. The blended numbers:
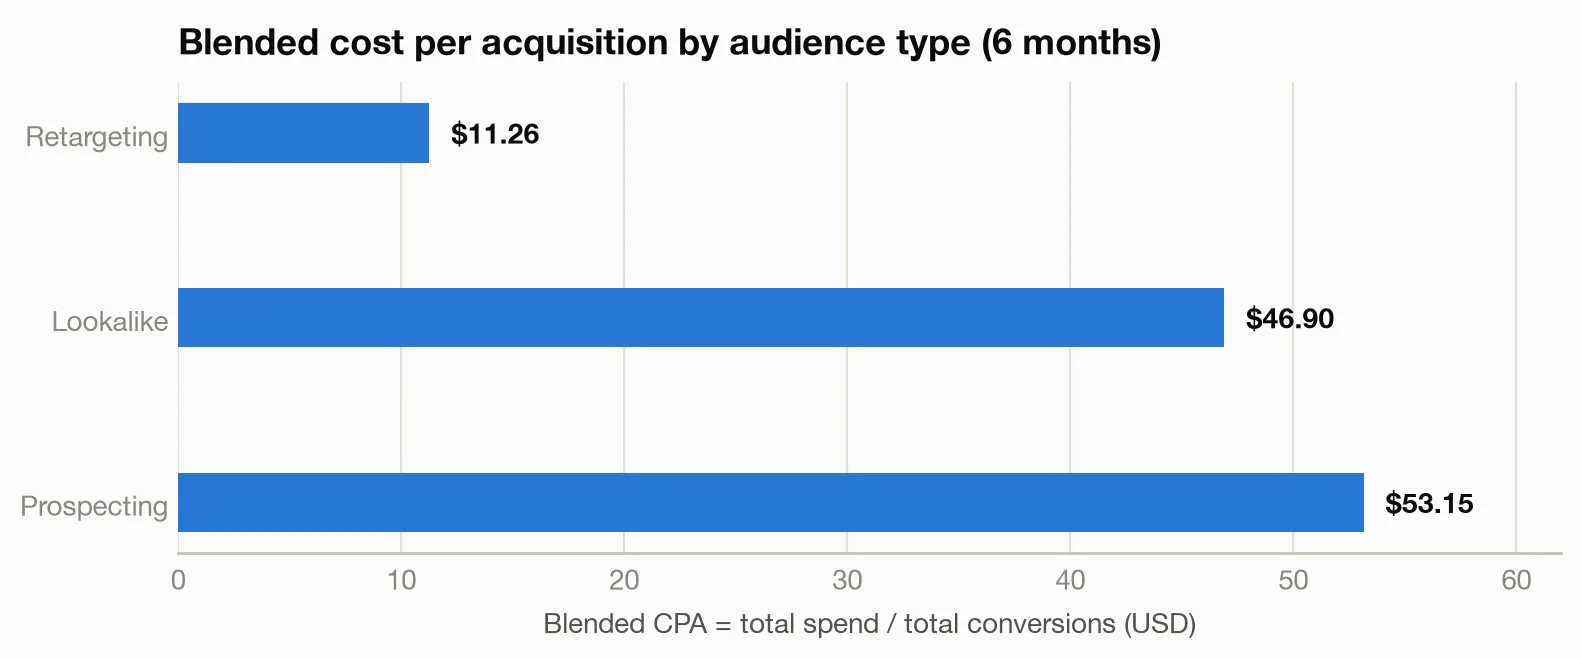
- Retargeting: $11.26 CPA, 6.27 ROAS
- Lookalike: $46.90 CPA, 1.39 ROAS
- Prospecting: $53.15 CPA, 1.23 ROAS
A 4.7x CPA gap between retargeting and prospecting. That doesn't mean "move everything to retargeting" — retargeting harvests demand prospecting planted, and it runs out of audience fast. It means prospecting-and-lookalike ROAS of 1.2–1.4 is the real economics of growth here, and any forecast built on the blended average is lying to you.
Intent split the same way by channel: Google Shopping and Search converted clicks at 6.4% and 5.9% — double Meta's 3.0% — even though Meta's video CTRs looked shinier. Clicks are not intent.
What actually drives ROAS — and can a model predict it?
Pivot tables show one variable at a time. So I had Claude train a prediction model to predict daily ROAS from audience type, creative type, platform, spend, and creative age — deliberately excluding giveaway columns like revenue that would let the model cheat.
Honest scorecard first: the model explains 68% of the day-to-day variation in ROAS (measured on test data it never saw during training, with a typical error of about 1.0x ROAS). That's decent, not oracular — daily ad performance is noisy, and a third of it stayed unexplained. The tool flagged exactly that: test scores "can be lower on new data."
The useful part is the shuffle test: scramble one column at a time and watch how much the predictions degrade. The column the model can least live without is the one doing the work.
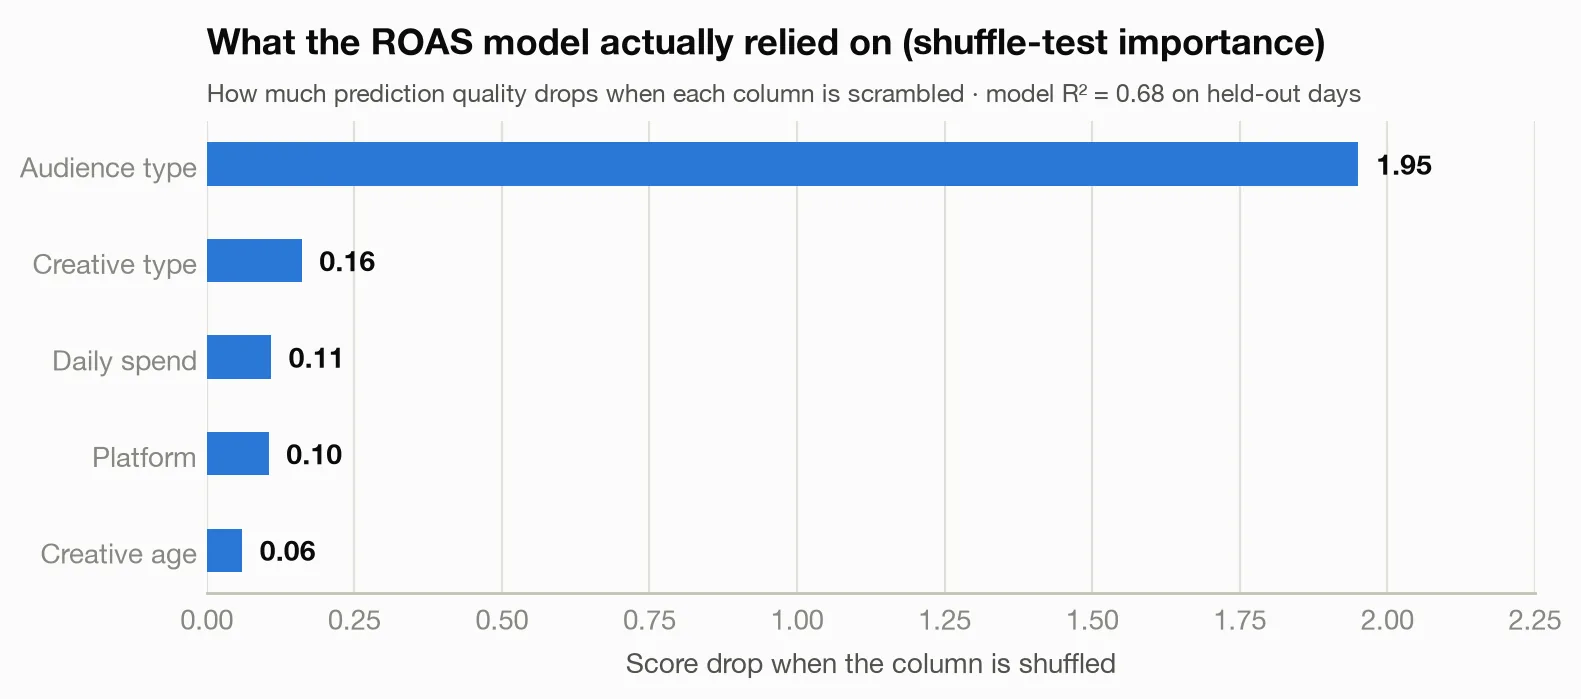
Audience type towered over everything — an order of magnitude ahead of creative type, with everything else barely registering. A second, independent driver analysis agreed, crediting ~89% of the explainable ROAS variation to audience type, and produced plain-English segment rules. My favorite, from the CPA version of that analysis: within retargeting at meaningful spend, days with creative under ~32 days old averaged $12.75 CPA versus $18.19 when the creative was older — the fatigue effect showing up independently, inside the money math, with the same ~30-day threshold.
Strategic translation: creative testing is worth real money (a 43% CPA swing inside retargeting!), but who you target dwarfs what you show them. If your team spends 80% of its meetings debating creative and 20% on audience architecture, this chart argues you have it backwards.
Why did my CPA go up when I raised budgets?
On June 1, the demo account did the classic thing: it saw a working prospecting campaign (M-Prospecting-Broad-Video) and raised its budget ~60%.
I asked Claude to compare the twelve weeks before against the twelve weeks after. The before/after test results:
- Spend: +57.0% (unambiguous — real beyond any reasonable doubt)
- Conversions: +3.9% — and the tool explicitly flagged that this lift is too small to trust. It "may well be noise."
- CPA: +50.9%, from $58.30 to $87.96 (statistically proven, not noise)
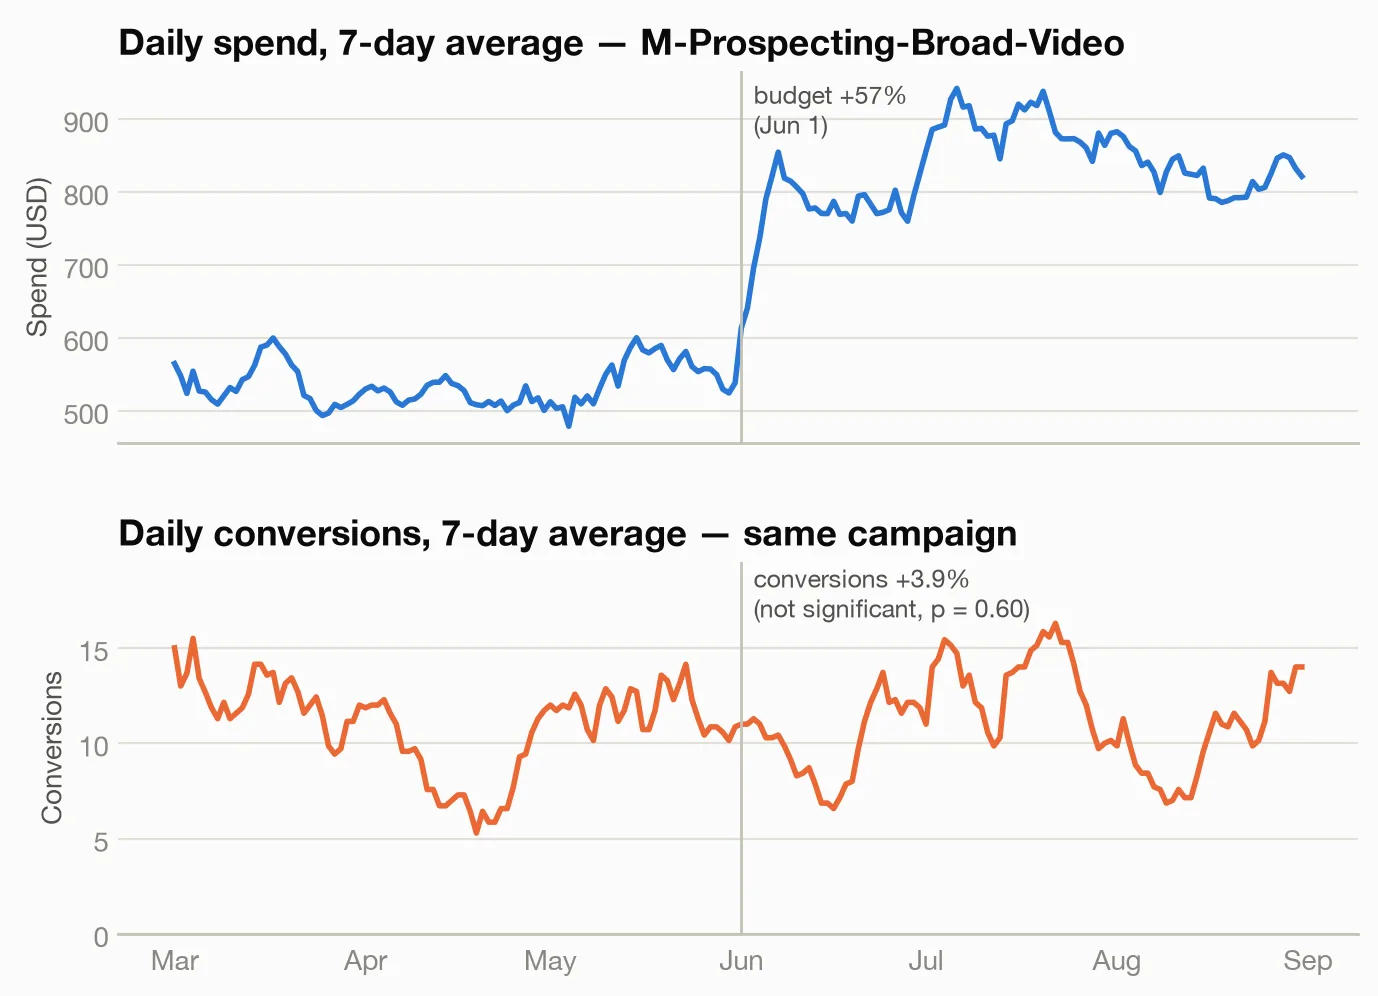
Run the arithmetic on the tool's own deltas and it gets ugly: roughly $305/day of extra spend bought about 0.4 extra conversions per day — around $720 per incremental conversion, against a ~$60 product. That's diminishing returns in one picture: the algorithm had already found the warm buyers at the old budget, and the extra dollars bought colder and colder traffic.
The tool appended a caveat easy to skip when doing this by hand: this is a before/after comparison, not a causal test — seasonality or a promo could explain part of the change. Here nothing else changed on June 1, so the budget is the prime suspect. But being told that, every time, is a discipline worth having.
Which campaigns are wasting money?
Two findings, one embarrassing and one alarming.
The embarrassing one: awareness-style video prospecting on Google (the YouTube campaigns) ran a 0.73 blended ROAS on $99,588 of spend — every dollar in, seventy-three cents out, for six months. Display-and-YouTube as a group converted clicks at 2.0% versus 5.9–6.4% for search and shopping. If those campaigns exist for brand lift, fine — but then stop grading them on ROAS. If they exist for direct response, they failed.
The alarming one: I asked Claude to hunt for outliers in daily Meta CPA. It flagged five days. Four of them — April 18–19, June 25, and July 7 — were catastrophic: daily CPA between $1,268 and $2,730 against a normal range of roughly $17–$40, because spend flowed normally while recorded conversions collapsed to near zero.
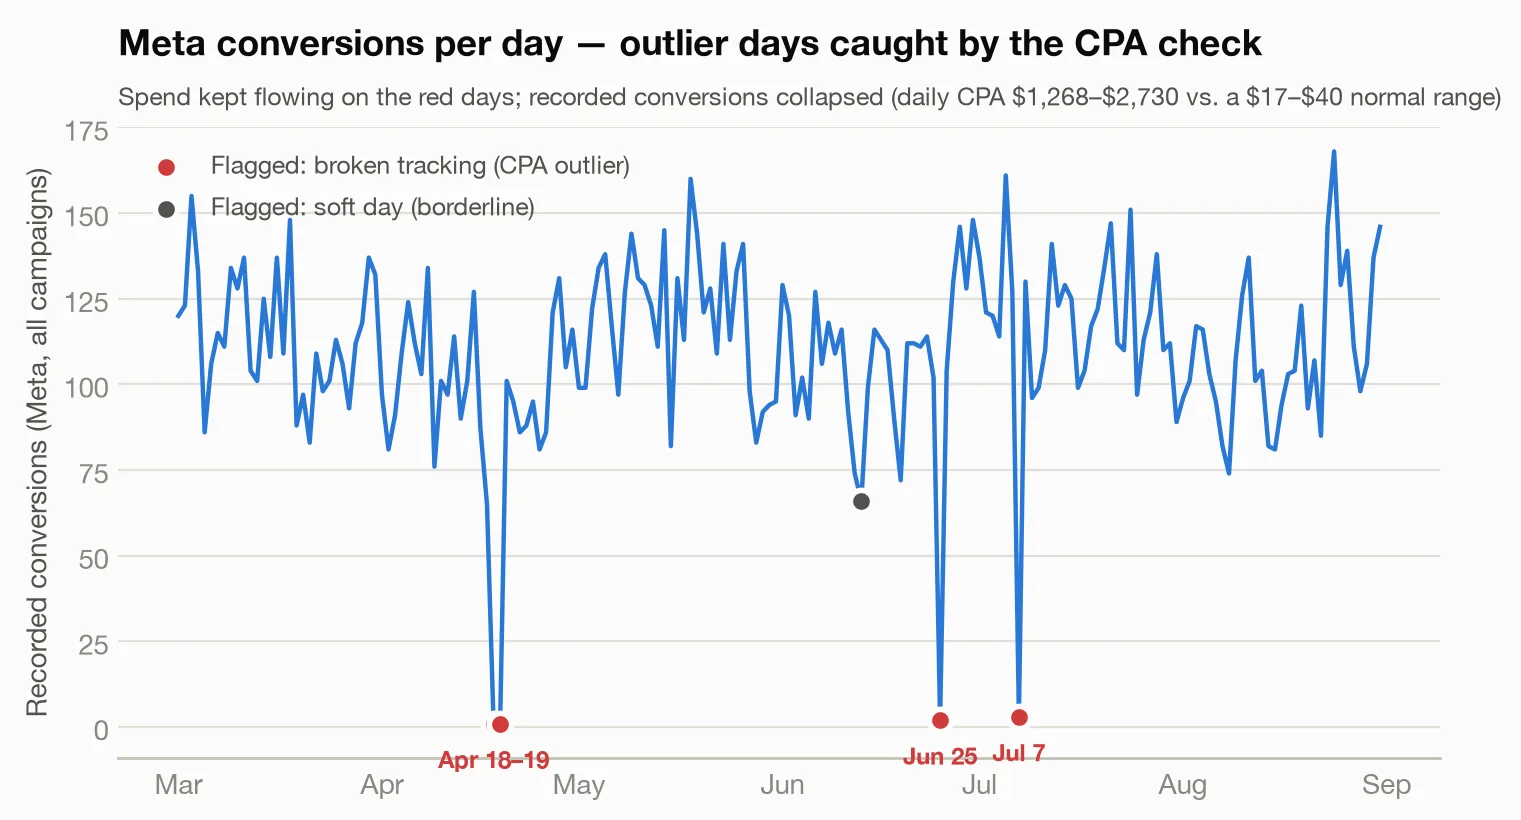
That pattern — normal spend, near-zero conversions, then back to normal — is broken conversion tracking, not broken campaigns. About $12,300 of spend flew blind across those four days, and days like that also poison the platform's optimization and your reporting averages. The fifth flagged day (June 13, $44 CPA) was just a genuinely soft day — a judgment call the tool explicitly left to me, with its caveat that it "flags statistical outliers, not necessarily errors."
If you take one operational habit from this post: run an outlier check on daily CPA before you judge any campaign. One tracking outage inside your date range can make a good campaign look mediocre.
Can I trust the numbers an AI gives me?
This is the part that converted me, so let me be specific about how it works.
Every single result came back with a trust level (high / moderate / low) and written caveats. The fatigue and audience findings were rated high-trust. The before/after budget comparisons were rated moderate — twelve weeks per side is "reasonable but not definitive," said the tool, about its own answer.
Then I tried to trick it. I asked whether ROAS changed after March 10 — a split that leaves only nine days of "before" data. It answered (−27.6% — a change that would technically clear the bar most dashboards use for "significant"!) but stamped the result low trust: "Small sample (9 points per window) — estimates are noisy; treat as directional." A result most dashboards would present proudly, correctly downgraded to a shrug.
Then I pushed further and asked it to compare periods around January 15 — before my data even starts. It flatly refused: "Each side of the split needs >=2 points; got before=0." No number. No guess. For the record, nothing in the main analysis was declined — this dataset could support every question I actually cared about — but knowing the system will refuse is what lets me believe it when it answers.
Contrast that with the default failure mode of AI tools: confident, fluent, wrong. A chatbot asked "did ROAS change after January 15?" will very often produce a plausible-sounding percentage. This setup structurally can't, because the AI never does the math — it only asks for it.
Why not just upload my CSV to ChatGPT or Claude?
Pasting a file into a chatbot is easier than connecting a tool. Three reasons the shortcut fails for ads data.
1. The chat re-reads your file on every question. My export is 3,496 rows. Pasted as text it fills most of a context window, gets silently sampled ("based on the first 200 rows..."), and every follow-up re-reads it all. Here the CSV loaded once into a local database. Claude sent a command — "compare CPA before and after June 1" — and got back a paragraph, not 3,496 rows. Twenty minutes and a dozen analyzes moved less data through the AI than one paste.
2. Computed numbers, not plausible ones. A model reading raw rows predicts your CPA token by token; ask it to sum a spend column twice and you can get two answers. Every figure here came from statistical code on the actual rows: the fatigue trend, the "may well be noise" verdict on the scale-up conversions, the $17–$40 normal CPA range. Each result named the method it chose and why — one suited to the fatigue data's lopsided shape. Same rows, same answer, every time. When the data couldn't support a question, it refused.
3. Your spend data stays local. The spreadsheet — ad spend, revenue, campaign strategy — never left my machine. The AI saw summaries: "retargeting CPA $11.26." For agencies handling client data, that's the whole ballgame.
FAQ
What is a good ROAS? A ROAS of 4:1 is a common rule of thumb for ecommerce, meaning four dollars of revenue for every one spent on ads. The honest target depends on your margins: if you keep 25% of revenue as gross profit, a 4:1 ROAS is roughly break-even, not good. Work out the ROAS at which an extra sale stops paying for itself, then judge campaigns against that number rather than an industry average.
How do you calculate CAC? Customer acquisition cost is total sales and marketing spend for a period divided by the number of new customers acquired in that period. Include agency fees, creative costs, and the salaries of people doing the work, not just the ad platform invoice — a CAC that counts only media spend flatters itself. Compare it against customer lifetime value; a business is usually healthy when lifetime value is at least three times CAC.
What is ad fatigue and how do you spot it? Ad fatigue is the decline in performance that happens as the same audience sees a creative repeatedly. The signal is a falling click-through rate at a steady or rising frequency, usually followed by rising cost per click and cost per acquisition. Track CTR against the age of each creative rather than in aggregate — the site-wide average hides the drop-off because fresh ads mask tired ones.
Why do ad platform conversion numbers not match analytics? Because they count differently. Ad platforms credit conversions to a click or view within an attribution window and will claim the same sale across two platforms; analytics tools usually credit the last non-direct source and only count once. Add cookie limits, consent banners, and cross-device journeys and a gap is guaranteed. Pick one source as the system of record for decisions, and use platform numbers only for comparing campaigns within that platform.
Do this with your own ads data
The setup takes about 15 minutes: export your data as CSV and follow the instructions in the meelu-analytics-mcp README. Then ask your questions in plain English — start with the ones in this post.
Frequently asked questions
How do you calculate ROAS?
Divide revenue attributed to the ads by the amount spent on them. Spend $5,000 and generate $20,000 and your ROAS is 4, often written 4:1 or 400%. Keep the revenue and the spend on the same attribution basis and the same date range, otherwise the figure is meaningless. For a profit view rather than a revenue view, use gross profit instead of revenue — that number tells you whether the campaign actually made money.
What is a good CPC or CPA?
There is no universal figure; both vary enormously by industry, platform, and intent. Competitive B2B and finance keywords cost many times what a low-competition consumer product does, and a click on search intent is worth more than a click on a display placement. The number that matters is whether your CPA sits below the profit you make from an average customer. Compare your own campaigns, audiences, and time periods against each other instead of hunting for a benchmark.
How long should you run an ad test before deciding?
Long enough to gather a meaningful number of conversions, which is usually at least a week or two and often several hundred conversions per variant. Short windows are dominated by day-of-week effects and random variation, which is how teams end up declaring winners that reverse the following month. If a comparison cannot be distinguished from noise, the honest conclusion is that the test is not finished, not that the variants are equal.
This post is part of building Meelu, an AI marketing agent that runs locally — site audits, data analysis, outreach, and social listening on your own machine. Join the waitlist to hear when it ships.
Related posts