How to Analyze Real Estate Data with AI: What Really Drives Home Prices
I loaded 3,497 home sales into a local AI analytics tool and asked it what drives prices, why listings sit, and when to sell. Real model, real numbers, honest confidence levels — and how agents can run the same analysis on their own MLS export.
Quick answer
Load an MLS or sales export into an AI-connected analytics engine like meelu-analytics-mcp and ask what drives prices. Across 3,497 demo home sales, the analysis separated features that genuinely move price from ones that merely correlate, explained why some listings sit unsold, and identified the best time of year to sell — every claim carrying a confidence level, with the tool declining questions the data couldn't answer.
Every agent gets the same questions. What's driving prices in this market? Why isn't my listing selling? Is a renovation worth it before we list? Should we wait for spring? The honest answer is usually a mix of experience and gut feel, because actually crunching two years of sales data takes tools most of us don't open.
So I ran an experiment. I took a sales dataset — 3,497 closed residential sales over 24 months across 10 neighborhoods — loaded it into the meelu-analytics MCP server (a local statistics engine that AI assistants like Claude can drive), and asked my questions in plain English. The AI didn't guess at answers; it sent commands to a real statistical engine running on my machine, and the engine sent back computed results, each stamped with a confidence level.
Full disclosure up front: this is a synthetic demo dataset for a fictional metro ("Maplewood"), generated so I could publish it freely — no client data on the internet. The workflow, the tools, the statistics, and every number below are real outputs from the analysis. At the end I'll show you how to run the exact same thing on your own MLS or brokerage export, privately, on your own computer.
What actually drives home prices in my market?
First question: of everything in a listing — beds, baths, square footage, lot, age, condition, neighborhood — what actually moves the sale price?
I asked the tool to train a pricing model (the same kind of prediction model that powers most automated valuation models) on the physical facts of each home, deliberately excluding list price so the model couldn't cheat. Then I asked it to grade itself on 875 sales it had never seen:
- It explains about 95% of price variation — about 95% of why one home sells for more than another is captured by these eight features.
- A typical error of about $23,154 — on average, the model's estimate lands within about $23K of the actual sale price, on homes with a median price of $356,000. That's roughly a 6.5% miss.
The tool attached an honest caveat to those scores: they come from one round of test data, and fresh data can score differently. Fair. But that's strong enough to trust the next question — which features is the model leaning on?
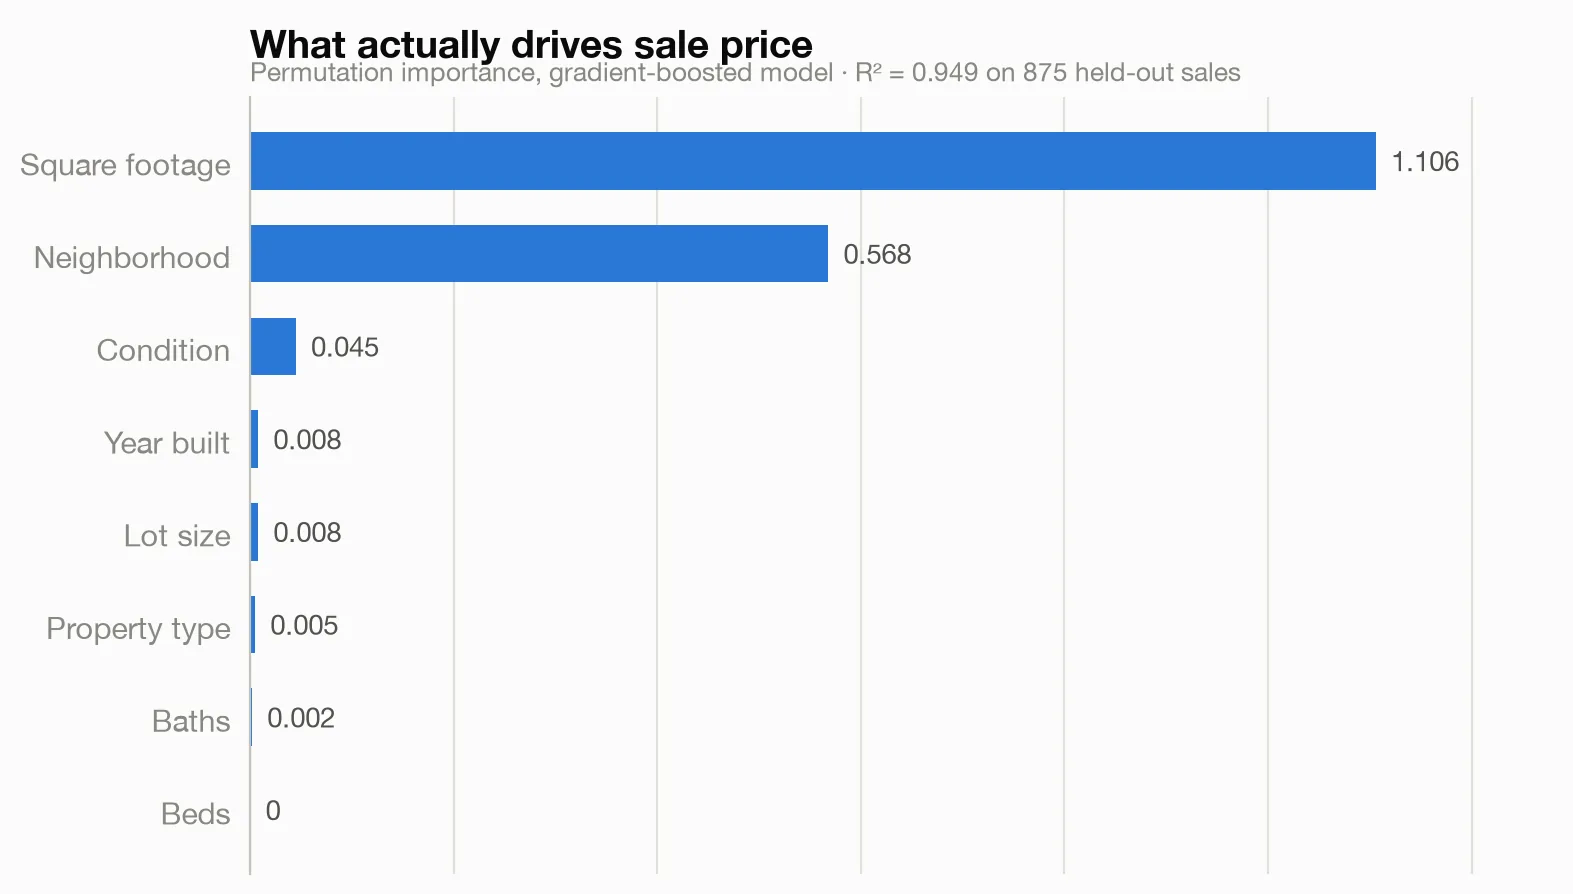
The answer, measured by hiding each feature from the model and seeing how much its accuracy collapses:
- Square footage — by far the biggest lever
- Neighborhood — half again as important as everything below combined
- Condition — real, but far smaller
- Everything else — year built, lot size, property type, baths, beds — barely registered
Bed count, the number on every flyer, contributed almost nothing once square footage is known. The tool's caveat here matters and I'll repeat it: importance shows what the model relied on, not what causes the price. Beds aren't worthless — they're just redundant once you know the square footage.
How do you explain a price to a seller — for one specific house?
Market-wide drivers are nice, but sellers care about their house. I picked one sale — listing ML-10234, a renovated 4-bed, 4-bath single-family home in Riverbend, 1,937 sq ft, built 1994 — and asked the tool to explain the model's estimate as an itemized receipt — a dollar contribution from each feature.
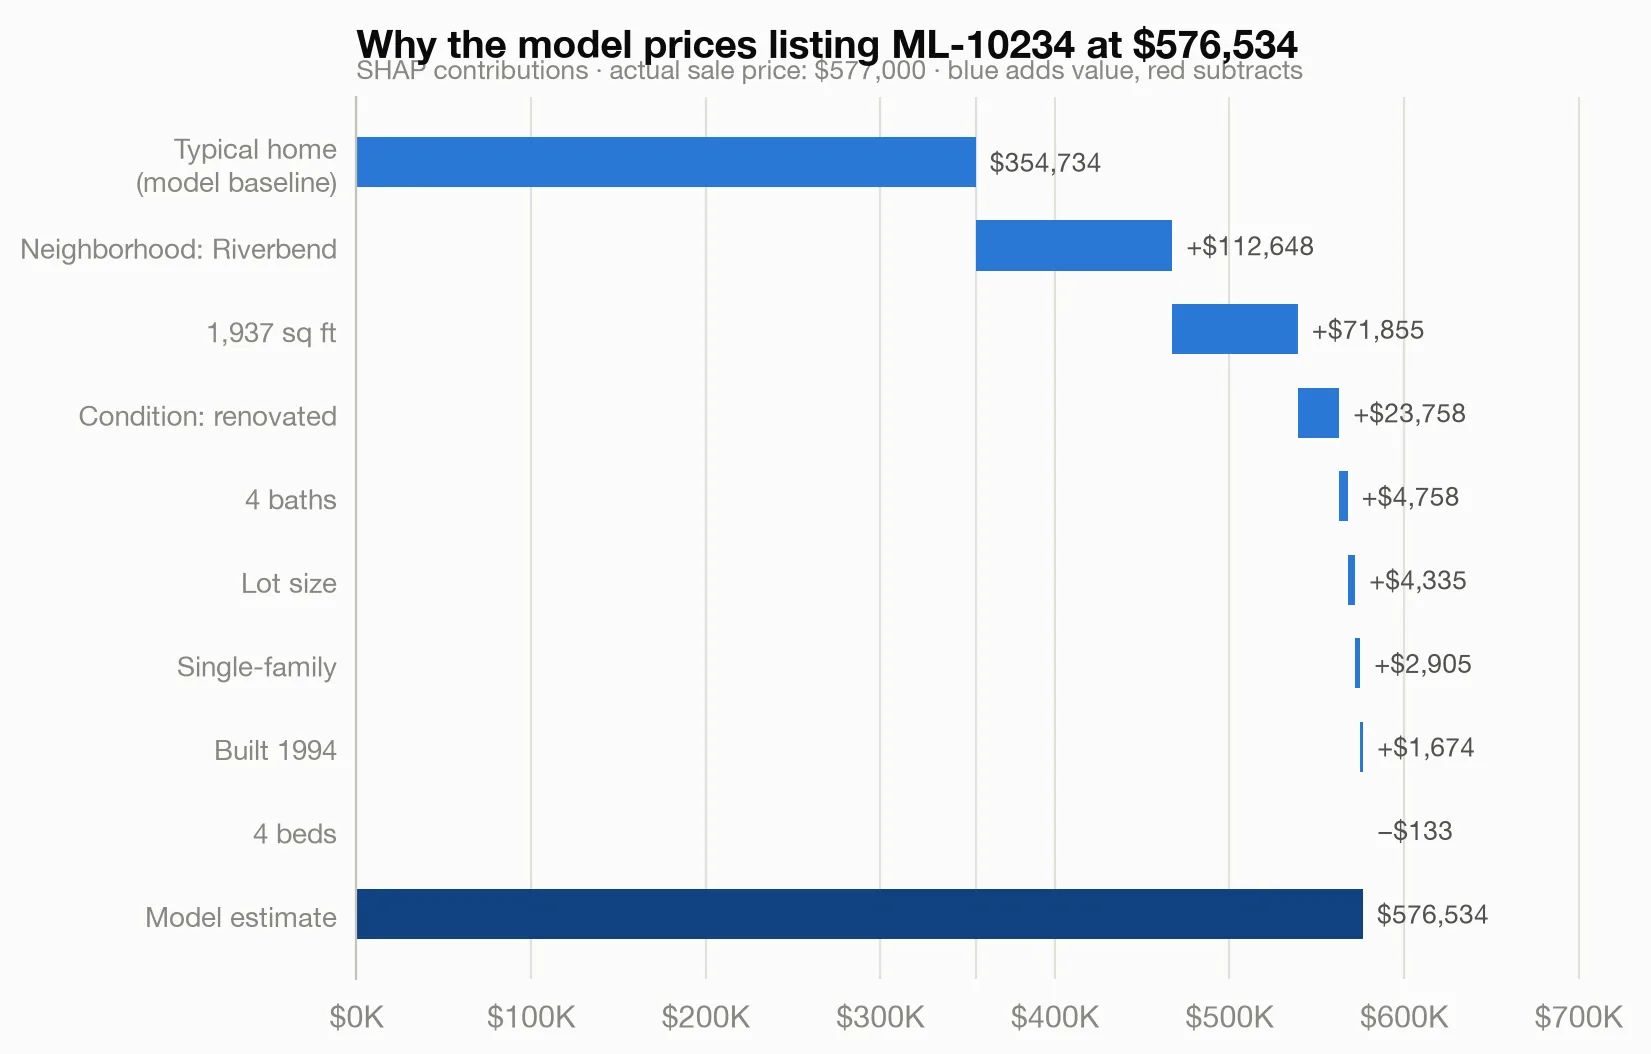
The plain-English version: start with the market's typical home at $354,734. Being in Riverbend adds $112,648. Its 1,937 square feet add $71,855. Renovated condition adds $23,758. Baths, lot, property type and age add a few thousand each; bed count subtracts a trivial $133. Total: $576,534. The home actually sold for $577,000 — a $466 miss.
That's a comp conversation a seller can follow, with dollar amounts attached to each claim. The tool marked this result moderate trust with a caveat worth respecting: the receipt explains this one prediction, not a global rule. Your renovation won't be worth exactly $23,758 on a different house.
Why isn't my listing selling?
This is the searing one. I asked the tool to explain days-on-market: out of twelve candidate columns, what best separates fast sales from stale ones?
It came back with a single dominant driver — the ratio of sale price to list price, i.e. how far above its eventual market value the home was listed. That one variable alone explained half of all variation in days-on-market, and the rules the tool found read like a pricing sermon:
- Homes that closed at more than 97.5% of list (priced right): ~16 days on market
- Homes that closed at 87.5–97.5% of list: 22–44 days, worsening as the gap grows
- Homes that closed below 87.5% of list (badly overpriced): ~88 days
I then grouped all 3,497 sales by how far the list price sat above the eventual sale price:
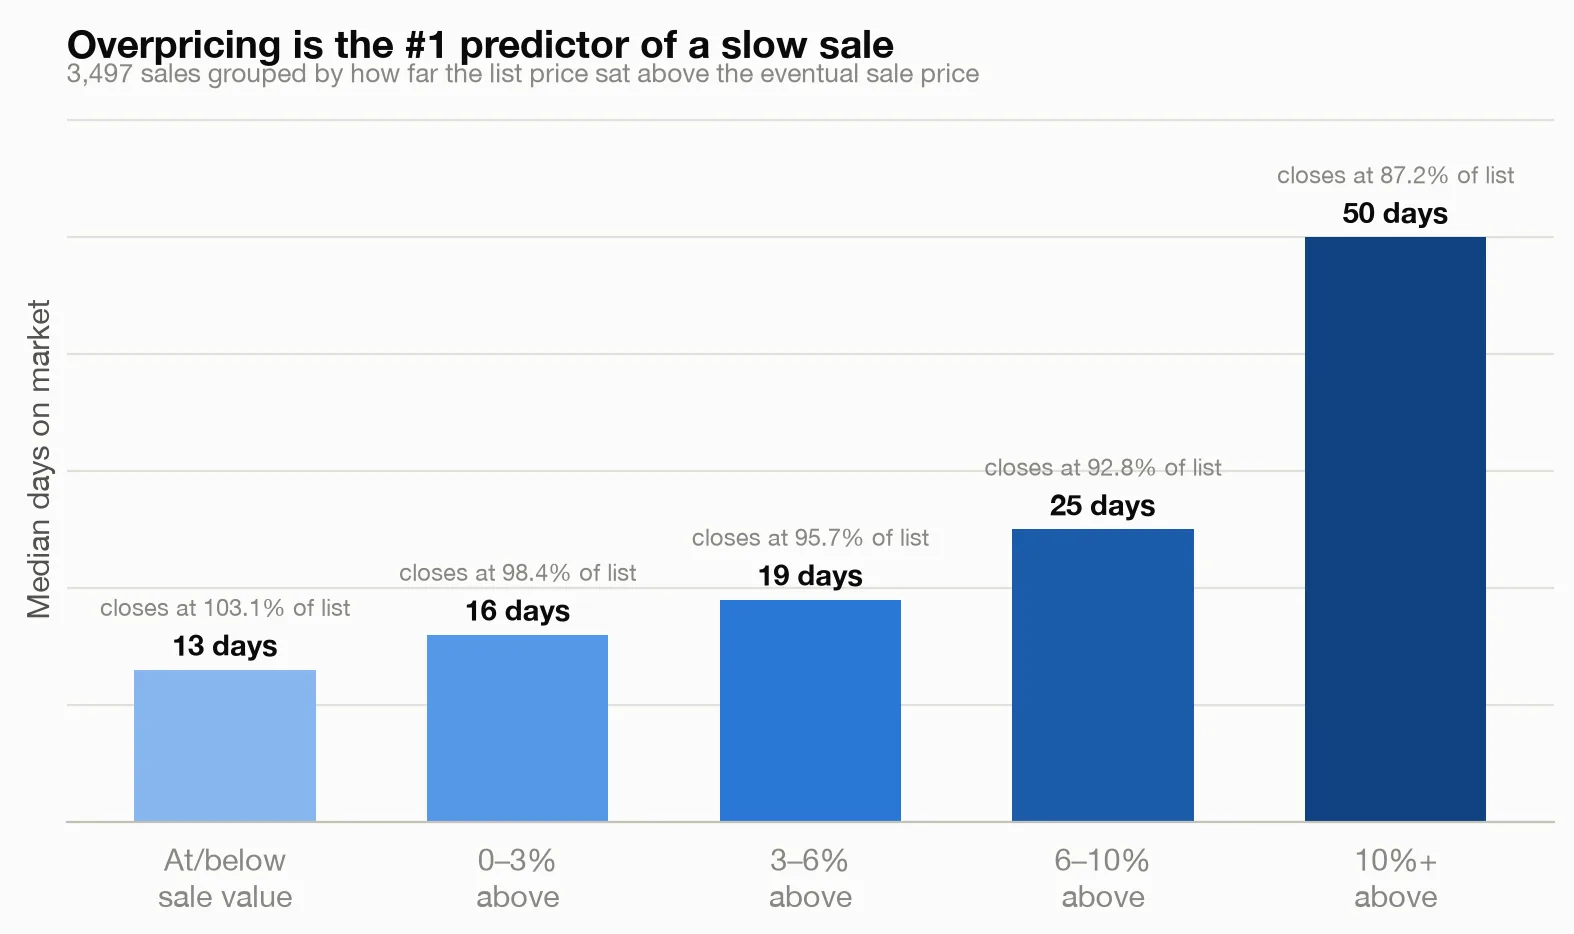
Homes listed at or below their eventual sale value sold in a median of 13 days — and actually closed at 103.1% of list, because sharp pricing invites competition. Homes listed 10%+ above sold in a median of 50 days and still only fetched 87.2% of list. Overpricing didn't protect the seller's number; it cost them the number and five extra weeks.
A formal test agreed: the link between overpricing and days-on-market is strong — and real beyond any reasonable doubt; a relationship this strong is essentially impossible to get by chance in 3,497 sales. The tool's caveat, which I'll pass along: this is association, not proof of causation, and strong as the link is, it explains only part of the story — condition photos, agent marketing, and luck still matter.
When is the best time to sell — and is this market cooling?
I aggregated the two years into monthly numbers and asked the tool to split the sales series into its underlying trend and its seasonal pattern.
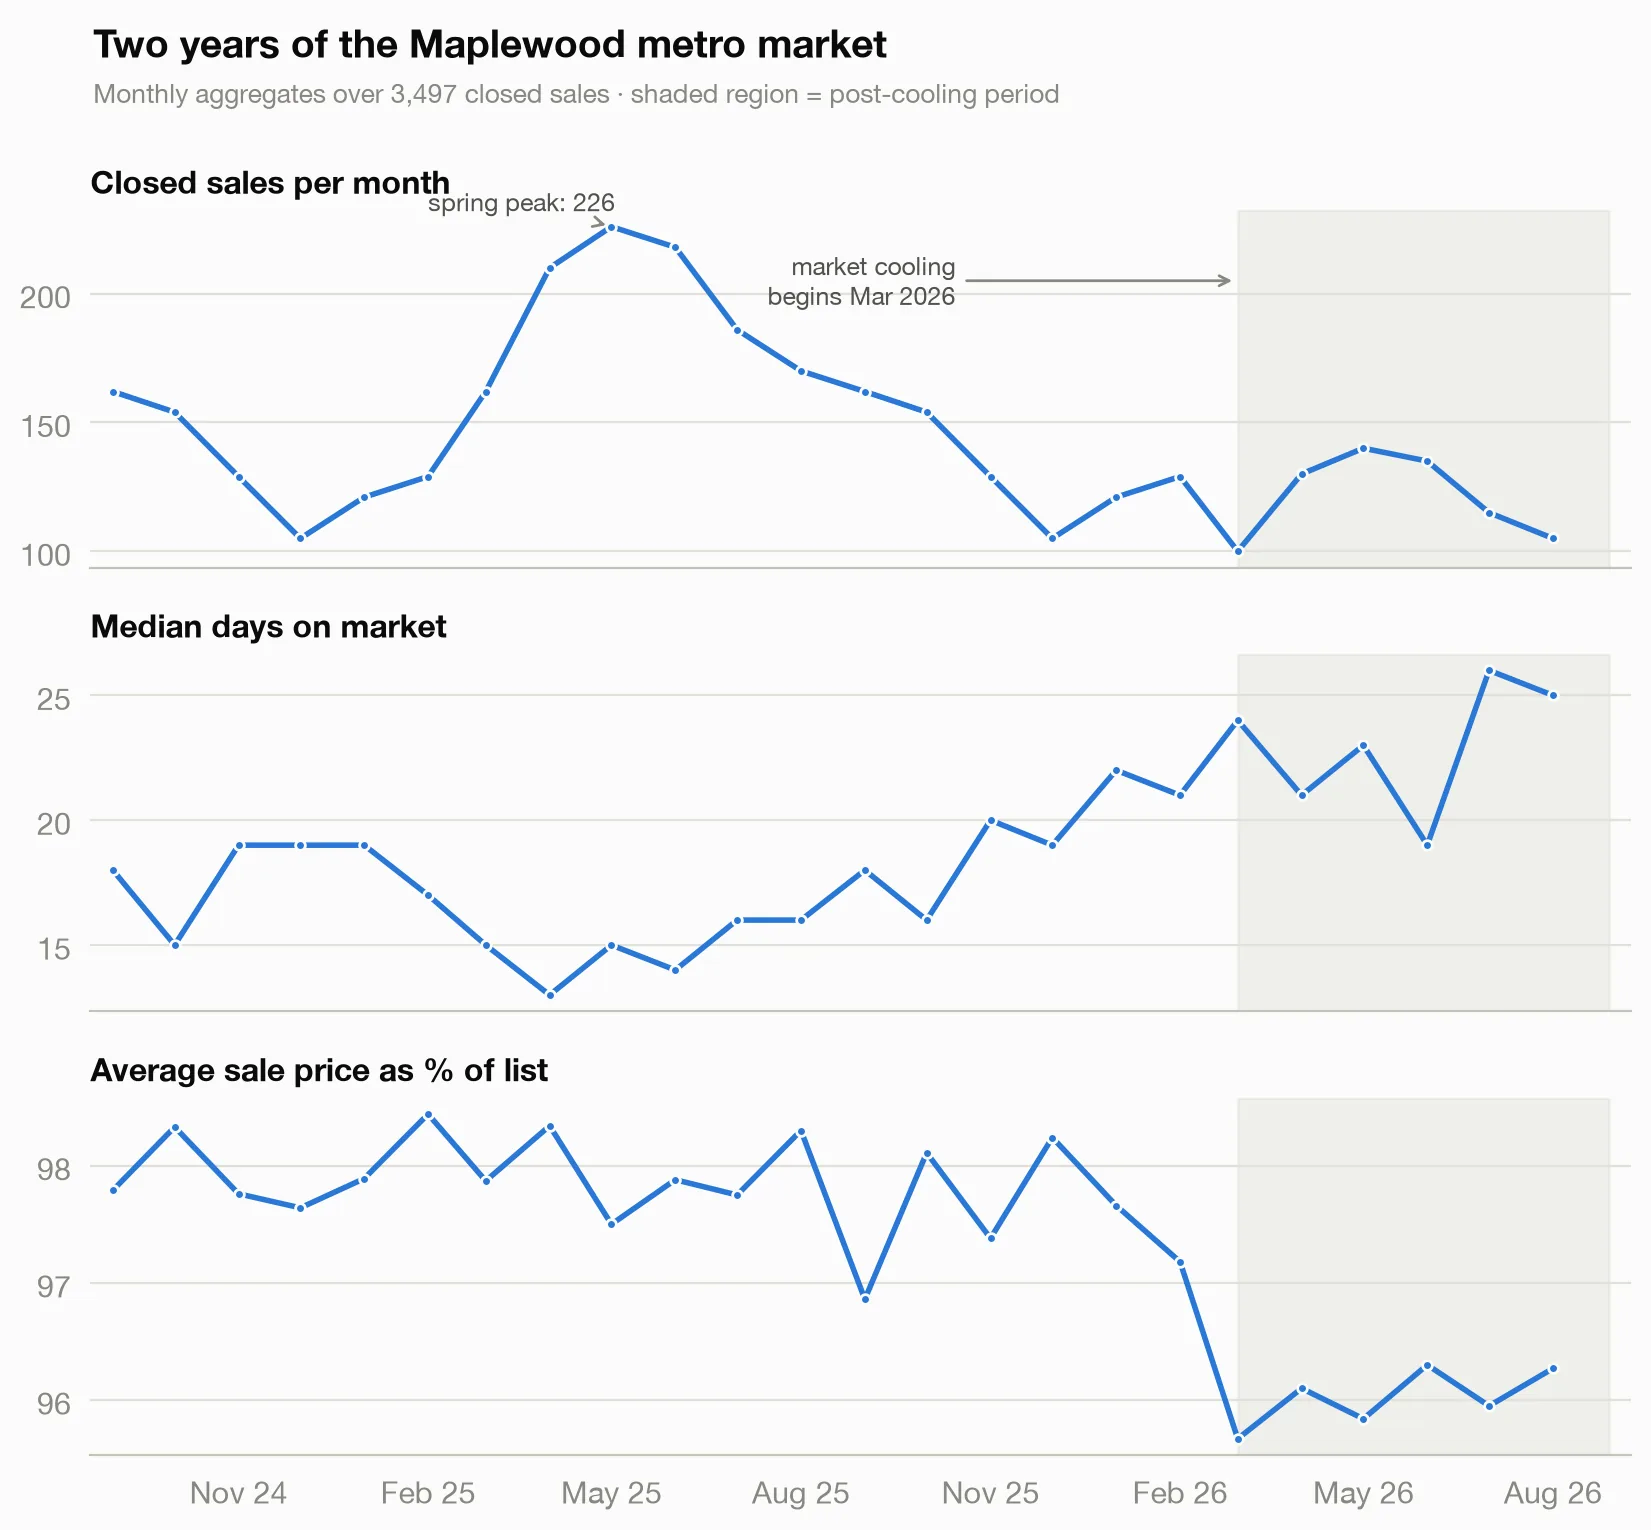
The seasonal pattern is unambiguous: relative to trend, May adds about 44 closed sales and December subtracts about 46 — a swing of roughly 90 sales a month between the spring peak and the winter trough. The tool rated this result moderate trust because 24 months is only two seasonal cycles — a thin base for a seasonal estimate — and I think that honesty is exactly right.
The cooling is a different story. I asked for a formal before/after comparison split at March 2026, and the tool checked each metric for whether the change was real or could be chance:
- Days on market: up 24.3% (average 23.0 → 28.6 days) — real beyond any reasonable doubt
- Sale price as % of list: down 1.8 points (97.8% → 96.0%) — real beyond any reasonable doubt
- Monthly sales volume: down 21.5% — but here the tool refused to call it real: with only six monthly data points after the split, it couldn't rule out chance. It labeled the result low trust and "directional."
That third bullet is my favorite moment in the whole analysis. The volume drop is visible on the chart, and it's real in this dataset — but with six post-cooling months, the numbers can't yet distinguish it from noise, and the tool said so instead of manufacturing confidence. When your data can't support a claim, you want a tool that tells you.
Do renovations actually pay off at sale time?
I tested condition against price per square foot directly:
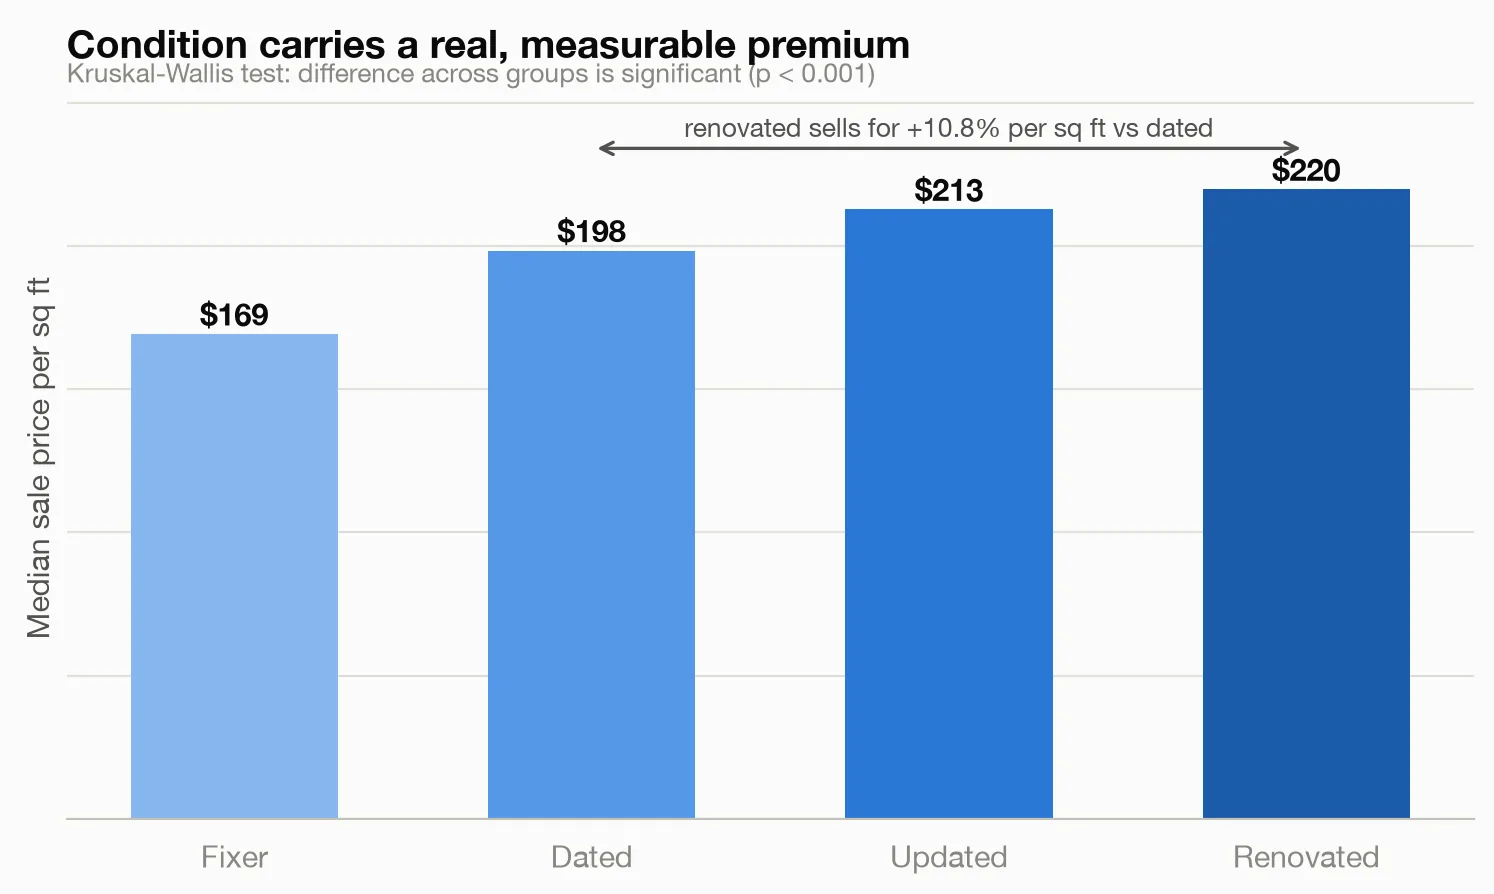
Median price per square foot climbs steadily: fixer $169 → dated $198 → updated $213 → renovated $220. Renovated homes sold for 10.8% more per square foot than dated ones — on a $400K dated home, that's roughly a $43K gap.
The tool compared the groups formally and found the differences real beyond any reasonable doubt. But it also reported the size of the effect honestly: condition explains about 7.5% of the total variation in price per square foot. Condition is a real premium — and still a small lever next to location and size. Renovate to move the needle, not to change the neighborhood you're in.
Which sales were genuinely mispriced?
Finally, I hunted for outliers on price per square foot — the deals and the overpays.
The first, naive pass (metro-wide thresholds) flagged only 10 sales, all on the expensive side, and most were simply homes in Oakhurst Heights, the priciest neighborhood ($305/sq ft median vs. $143 in Harborview Flats). A metro-wide test can't tell "mispriced" from "nice zip code" — a limitation worth knowing about any automated flag.
So I re-ran it the right way: each sale's price per square foot divided by its own neighborhood's median, then outlier detection on that ratio. This time the tool flagged 19 sales by both of its outlier checks — in both directions:
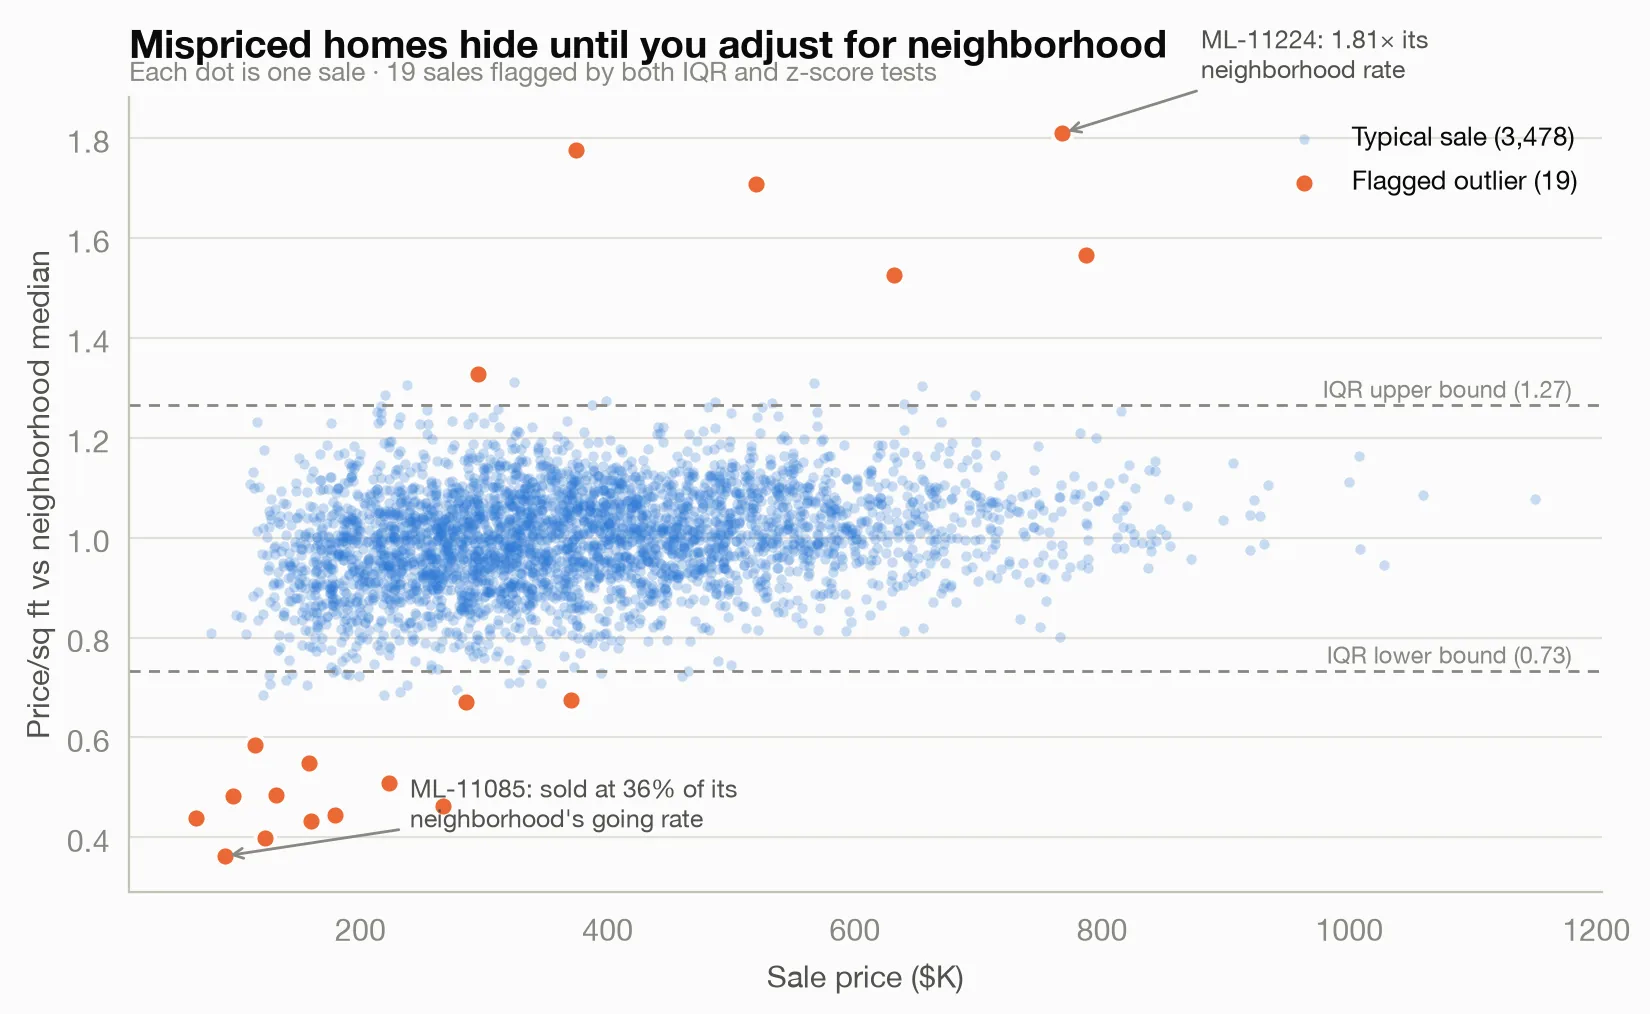
At the bottom: ML-11085, a Maple Grove condo that sold for $90,000 — 36% of its neighborhood's going rate. At the top: ML-11224, a Stonegate home that fetched 1.81× its neighborhood rate. In a real dataset, that bottom cluster is where you look for off-market family transfers, data-entry errors, distress sales — or the buyers who got the deal of the year. The tool's caveat applies: these are statistical outliers, not proven errors; they're where to start investigating.
Why not just upload my sales data to ChatGPT or Claude?
Three things separate this from pasting your spreadsheet into a chat window.
1. The chat re-reads your file on every question. A 3,500-row CSV is a few hundred thousand tokens. A chatbot may truncate it silently, then reads it all again per follow-up. Here the CSV loaded once into a local database; Claude sent short commands — "train a pricing model on sale_price," "compare periods split at 2026-03-01" — and got small results back. The whole session (model training, price receipts, seasonality, outliers) cost less text than one pasted spreadsheet.
2. Real computation, on the record. A chat model "computing" a median predicts plausible text: ask twice, get two answers. Here code produced each figure, logged its method for audit, and repeated the same answer every time. When the data couldn't support a conclusion — my sales-volume drop — the tool declined, and every result carried the trust level (high/moderate/low) reported throughout this post.
3. Your client data stays home. The sales pipeline, client names, and commission figures never left my machine. The engine computes locally; the AI sees summary statistics, never the raw rows.
FAQ
What affects house prices most? Location does more work than anything else, followed by size — square footage and number of bedrooms — then condition and age. Within a single market, where the other factors are similar, the biggest movers tend to be usable floor area, whether the property has been renovated recently, and specific features such as parking or outdoor space. National trends like interest rates set the level for everyone, but they rarely explain why two houses on the same street sell for different amounts.
How do you estimate what a house is worth? The standard method is comparable sales: find recently sold properties nearby that match on size, type, and condition, then adjust for the differences. Statistical models do the same thing at scale, fitting the relationship between features and sale price across thousands of transactions, which is how automated valuations work. Either way the estimate is a range, not a number — even good models are typically several percent off on any individual property.
How long does it take to sell a house? Typically one to three months from listing to accepted offer in a normal market, plus several more weeks to complete. The spread matters more than the average: well-priced homes in demand often go in under two weeks, while overpriced ones can sit for months and then sell below what they would have fetched at the right asking price initially. Days on market is one of the most reliable signs that the pricing was wrong.
Does renovating add value to a house? Usually yes, but rarely pound for pound. Kitchens, bathrooms, and anything that fixes a genuine defect tend to return the most; highly personal or over-specified work returns the least, because it appeals to fewer buyers. Renovated properties often sell both for more and faster, though part of that premium reflects the kind of homes that get renovated rather than the work itself.
Do this with your own MLS or brokerage export
The setup takes about 15 minutes: export your data as CSV and follow the instructions in the meelu-analytics-mcp README. Then ask your questions in plain English — start with the ones in this post.
Frequently asked questions
What is an automated valuation model?
An automated valuation model, or AVM, is a statistical model that estimates a property's value from its characteristics and from nearby recent sales. It learns how much each feature — floor area, bedrooms, age, condition, location — contributes to price across thousands of transactions, then applies that to the property in question. AVMs are fast and consistent but they cannot see condition, view, or noise, so they perform best on typical homes in areas with plenty of sales and worst on unusual properties.
How accurate are house price predictions?
A good model typically lands within a few percent of the eventual sale price on average, with individual errors much larger. Accuracy depends on the market: dense areas with frequent, similar sales predict well, while rural or unusual properties predict badly because there is little to compare against. Treat any single estimate as the middle of a range and expect the tails to be wide — the useful output is the range and the reasons behind it, not the headline figure.
How much sales data do you need for a property price analysis?
A few thousand transactions gives a reliable picture for a market; a few hundred is enough for broad descriptive comparisons but too thin for a pricing model. The constraint is usually not the total but the slice: once a question narrows to one property type in one postcode over six months, you can be down to a few dozen sales and the answer becomes noise. Pay attention to sample size warnings and widen the window before trusting a narrow cut.
This post is part of building Meelu, an AI marketing agent that runs locally — site audits, data analysis, outreach, and social listening on your own machine. Join the waitlist to hear when it ships.
Related posts