How to Use AI to Analyze Business Expenses (QuickBooks, Xero, Any Export)
I used a local AI analytics server to analyze 4,692 business expense transactions: it found $18,000 in duplicate payments, a hidden 45% price hike, and $18,359 in anomalous invoices. Here's how to do it with your QuickBooks or Xero export.
Quick answer
Export transactions from QuickBooks or Xero to CSV, connect an AI assistant to an analytics engine like meelu-analytics-mcp, and ask it to find duplicates, price hikes and anomalies. On 4,692 demo transactions it found about $18,000 in duplicate payments, a hidden 45% vendor price increase, and $18,359 in anomalous invoices — roughly $37,000 of problems, each verified by a recorded check — computed, not eyeballed.
Every small-business owner asks the same three questions about their books: Where is money leaking? What changed? How long can I keep this up? The answers are sitting in your QuickBooks or Xero export — but they're buried under thousands of rows nobody has time to read.
I wanted to know how well an AI assistant could answer those questions if you gave it real analytical tools instead of asking it to eyeball a spreadsheet. So I built a test: a demo dataset of 4,692 expense transactions covering 24 months (September 2024 – August 2026) for a fictional 12-person creative agency, with realistic problems planted in the noise — duplicate payments, a vendor price hike, anomalous invoices, subscription creep. Then I loaded it into the meelu-analytics MCP server — a local analytics engine that Claude can drive — and asked questions in plain English.
Full disclosure up front: this is generated demo data, built so I could check the tool's answers against known ground truth. Every number below comes from an actual tool result, not from the AI's imagination. That distinction turns out to be the whole point.
The headline: the analysis surfaced $37,257.90 in recoverable or questionable payments — duplicates, overcharges, and a stealth price increase — plus a subscription bill growing $52,000/year faster than it was two years ago.
How do you analyze business expenses with AI, exactly?
The workflow is short. The MCP server (MCP is the Model Context Protocol — a standard way to plug tools into an AI assistant) reads CSVs from a local folder, loads them into a session, and exposes real analytical operations: profiling, database queries, anomaly checks, changepoint checks, forecasting. The AI picks the tool; the tool does the math with actual code.
I dropped two files in — transactions.csv (txn_id, date, vendor, category, amount, payment method, memo) and monthly_income.csv — and said, in effect: profile this, then find where money is leaking.
The profile came back in seconds: 4,692 transactions, 69 vendors, 10 categories, zero missing values. Median transaction $90.60, average $707.37 — an average eight times the median tells you a handful of big payments (payroll, contractors) dominate a sea of card swipes. Total spend over the window: $3.32M against average revenue of $169,189/month.
Each result also carries a trust block — a confidence level with explicit caveats — and the tools refuse outright when the data can't support an answer. You'll see both below.
Why are my business expenses going up?
First question every owner asks when the bank balance feels tighter. The category view answers it fast:
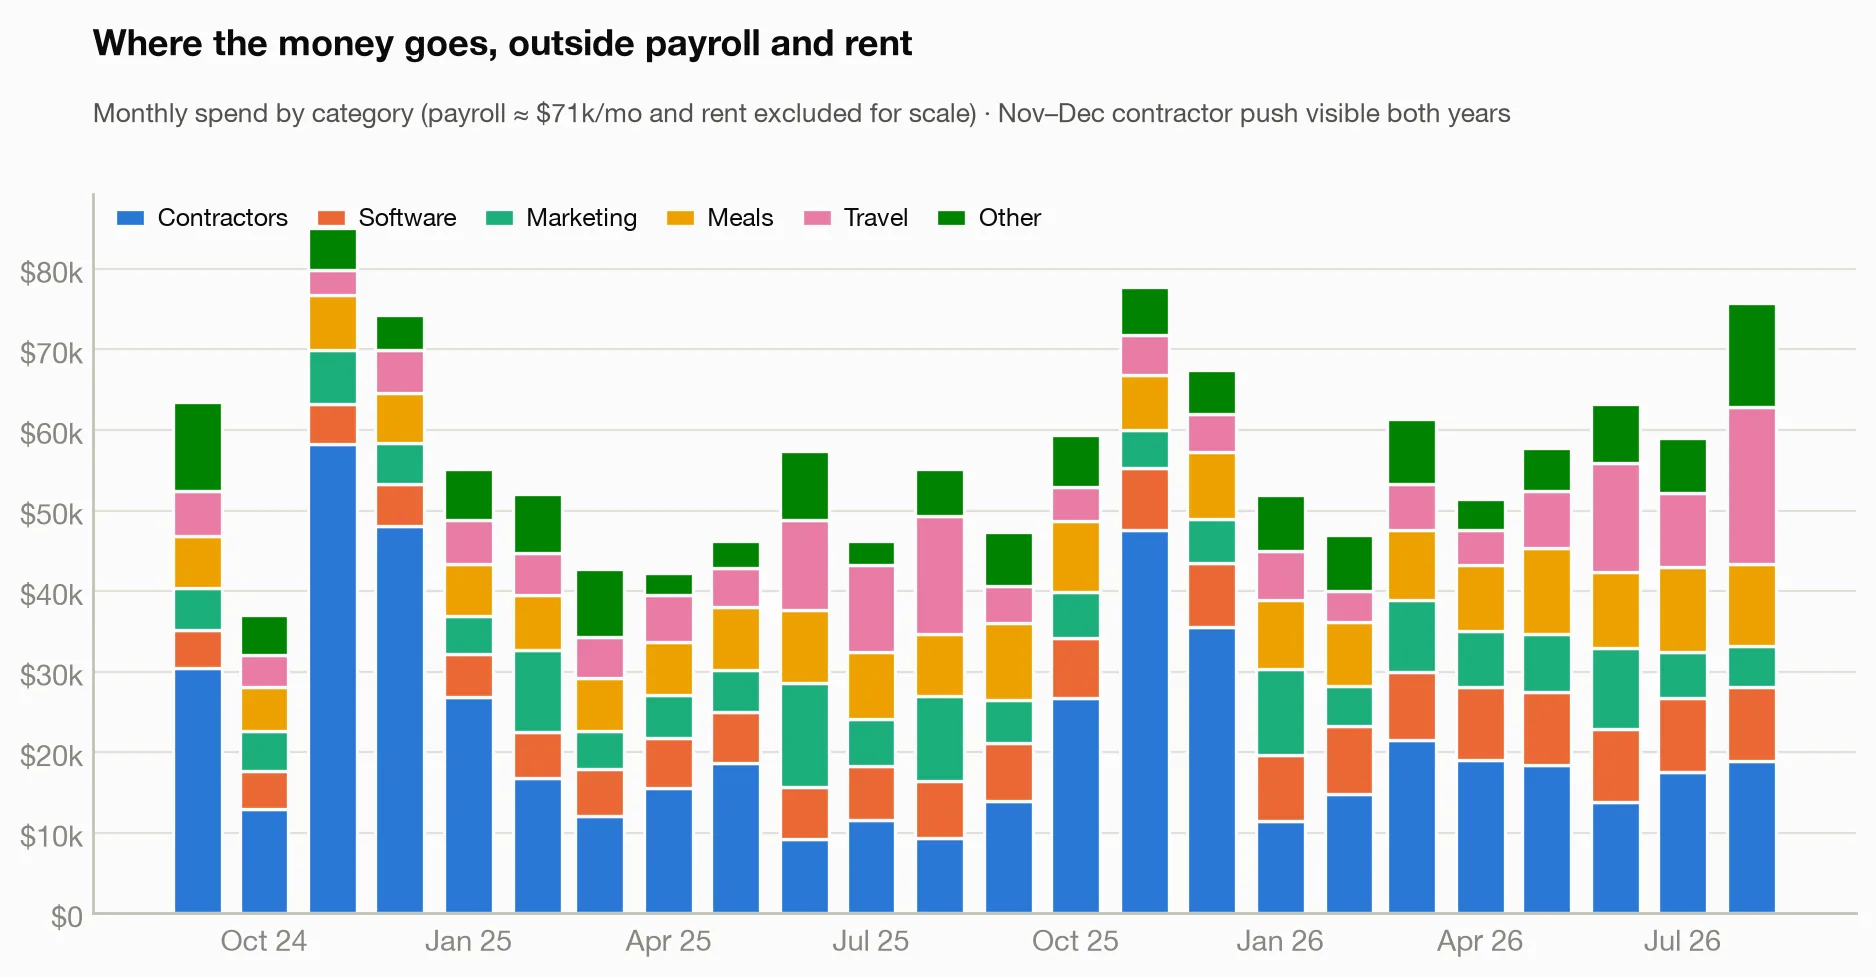
Payroll (~$71k/month) and rent are stable, so the movement is in everything else. A seasonal breakdown (splitting the monthly totals into an underlying trend, a seasonal pattern, and leftover noise) of total monthly spend found:
- Trend: underlying spend rose from ~$130.3k/month to ~$142.2k/month across the window — a steady $12k/month climb that has nothing to do with seasonality.
- Seasonality: November runs about +$25.3k and December +$14.2k above trend — the year-end contractor push, visible in both years.
The tool rated this moderate trust and said why: only two seasonal cycles of history, so the seasonal estimate "is thin and may absorb one-off events." That's the honesty you want from an analyst.
So expenses are up for two reasons that feel identical in the checking account but need opposite responses: a seasonal spike that reverses itself, and a structural climb that doesn't. The next three sections are the structural part, itemized.
How much is subscription creep really costing me?
Software was the fastest-growing category, and the shape is textbook SaaS creep:
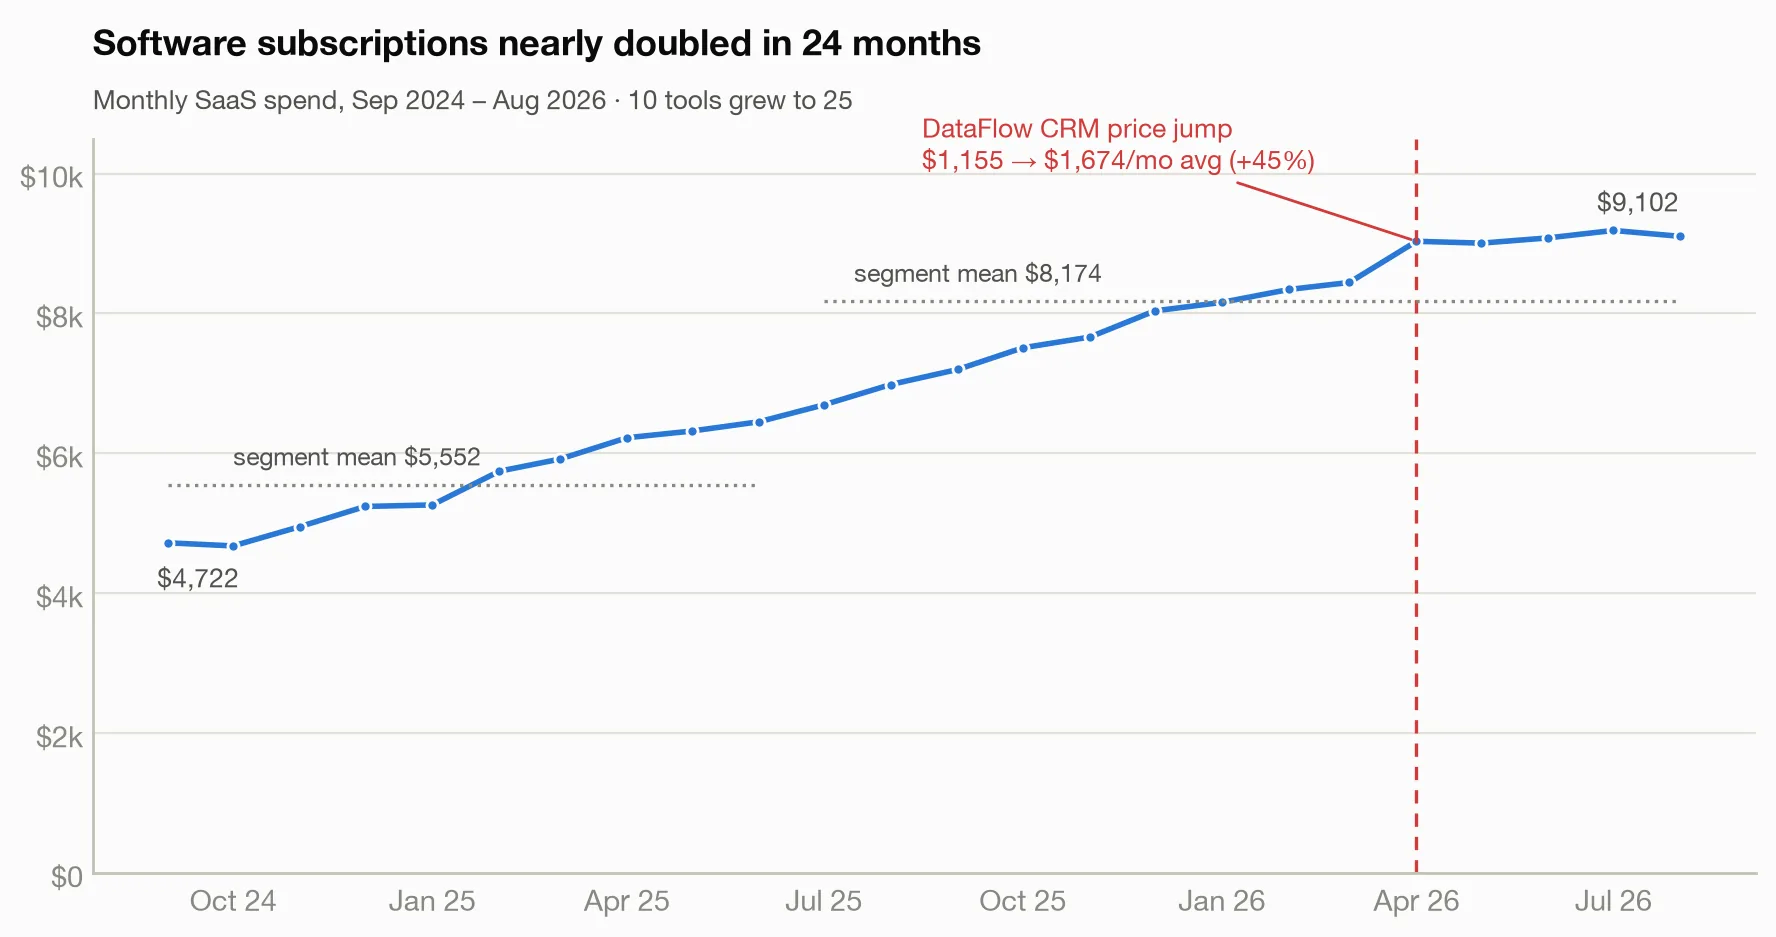
By the numbers (all from queries run inside the session):
- Monthly SaaS spend went from a $4,785/month average (first three months) to $9,123/month (last three months) — a run-rate increase of $52,052 a year.
- The count of software vendors billing the company grew from 10 to 25. No single decision did this; tools just accumulate.
Then I asked for a changepoint check — a tool that finds the exact moment a series shifts behavior, rather than a human squinting at a chart. Here the tool did something refreshing: it refused. An optional component it needed wasn't installed. No fake answer, no hand-waving; a refusal with a fix. One quick install into the server's environment later (no restart needed), it ran.
At the default sensitivity it found zero break points — a smooth ramp has no single break, which is itself informative: creep isn't an event. At a more sensitive setting it split the series at July 2025: segment means of $5,552/month before vs $8,174/month after. The trust level was low — "24 points, treat as directional" — and honestly, on a smooth ramp a single break date is a summary, not a discovery.
The discovery came from drilling into one vendor. DataFlow CRM (the fictional stand-in for that mission-critical tool you can't quit): average invoice $1,155.04 through March 2026, $1,673.85 from April on — a 45% price jump. A changepoint check on that vendor's own invoices confirmed a step (it placed the break at May 2026, one month after the first raised invoice — small-sample fuzziness the tool itself warned about; the invoice-level query pinned April). Cost so far: $2,594.04 paid above the old rate in five months, or $6,226/year going forward if nobody calls to renegotiate.
How do I find duplicate payments in QuickBooks data?
This is the purest "found money" and the easiest question. One query inside the session: flag any payment where the same vendor received the same amount within five days.
It returned nine suspected repeats. Then came the important part — reviewing them, because one was innocent: an insurance premium of $1,120 billed June 30 and again July 5 is just a fixed monthly bill straddling a month boundary. Any duplicate-detection method will surface those; a human (or a follow-up query counting payments per vendor per month) has to clear them.
The other eight were real:
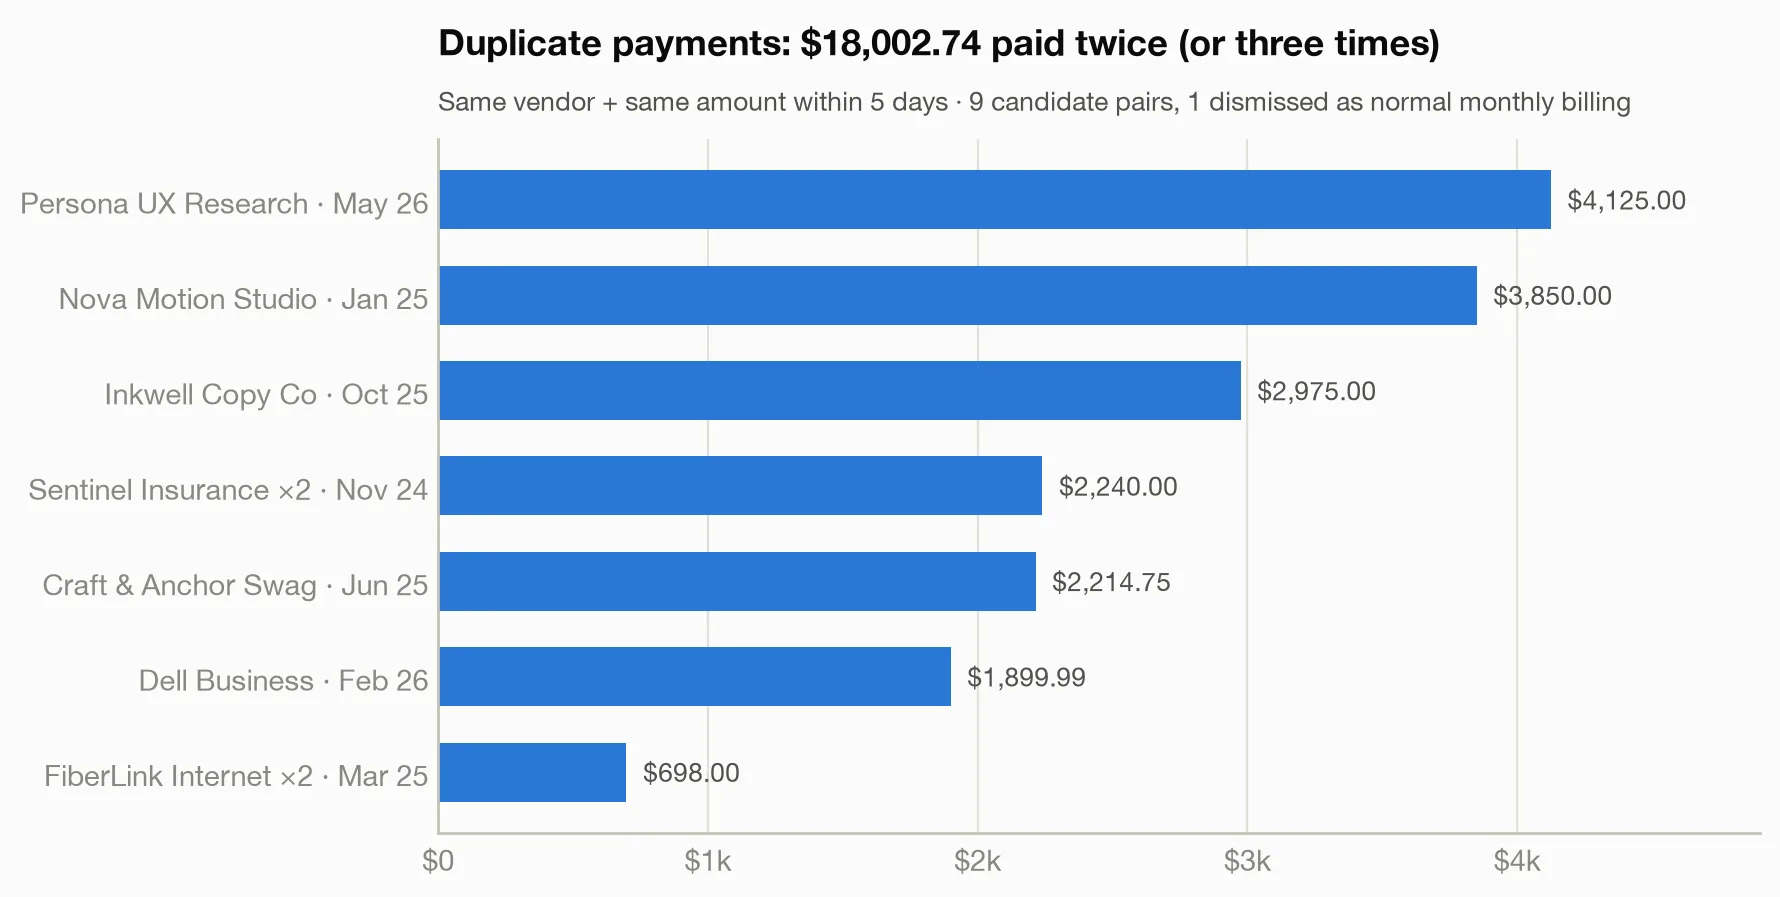
Two hurt extra: the insurance premium was paid three times in November 2024 ($2,240 excess), and the internet bill three times in March 2025 ($698 excess) — confirmed by a per-month payment count. Total overpaid: $18,002.74 across 18 months. Real-world audits find exactly this pattern: an invoice emailed twice, entered twice, paid twice — and most vendors won't volunteer a refund.
Which vendor is quietly overcharging me?
A company-wide anomaly check (which flags values far outside the typical range) flagged 643 unusual payments, mostly payroll runs: extreme on paper, completely legitimate. The tool's own caveat said as much: outliers are "not necessarily errors."
The interesting failure came next. A standard per-vendor anomaly scan missed the worst offender entirely — because when a vendor has four wild invoices, those invoices stretch the vendor's own picture of "normal" until they hide themselves. The fix: compare each invoice to the vendor's median — its middle, typical invoice, unaffected by extremes — instead of its average. That scan lit up immediately:
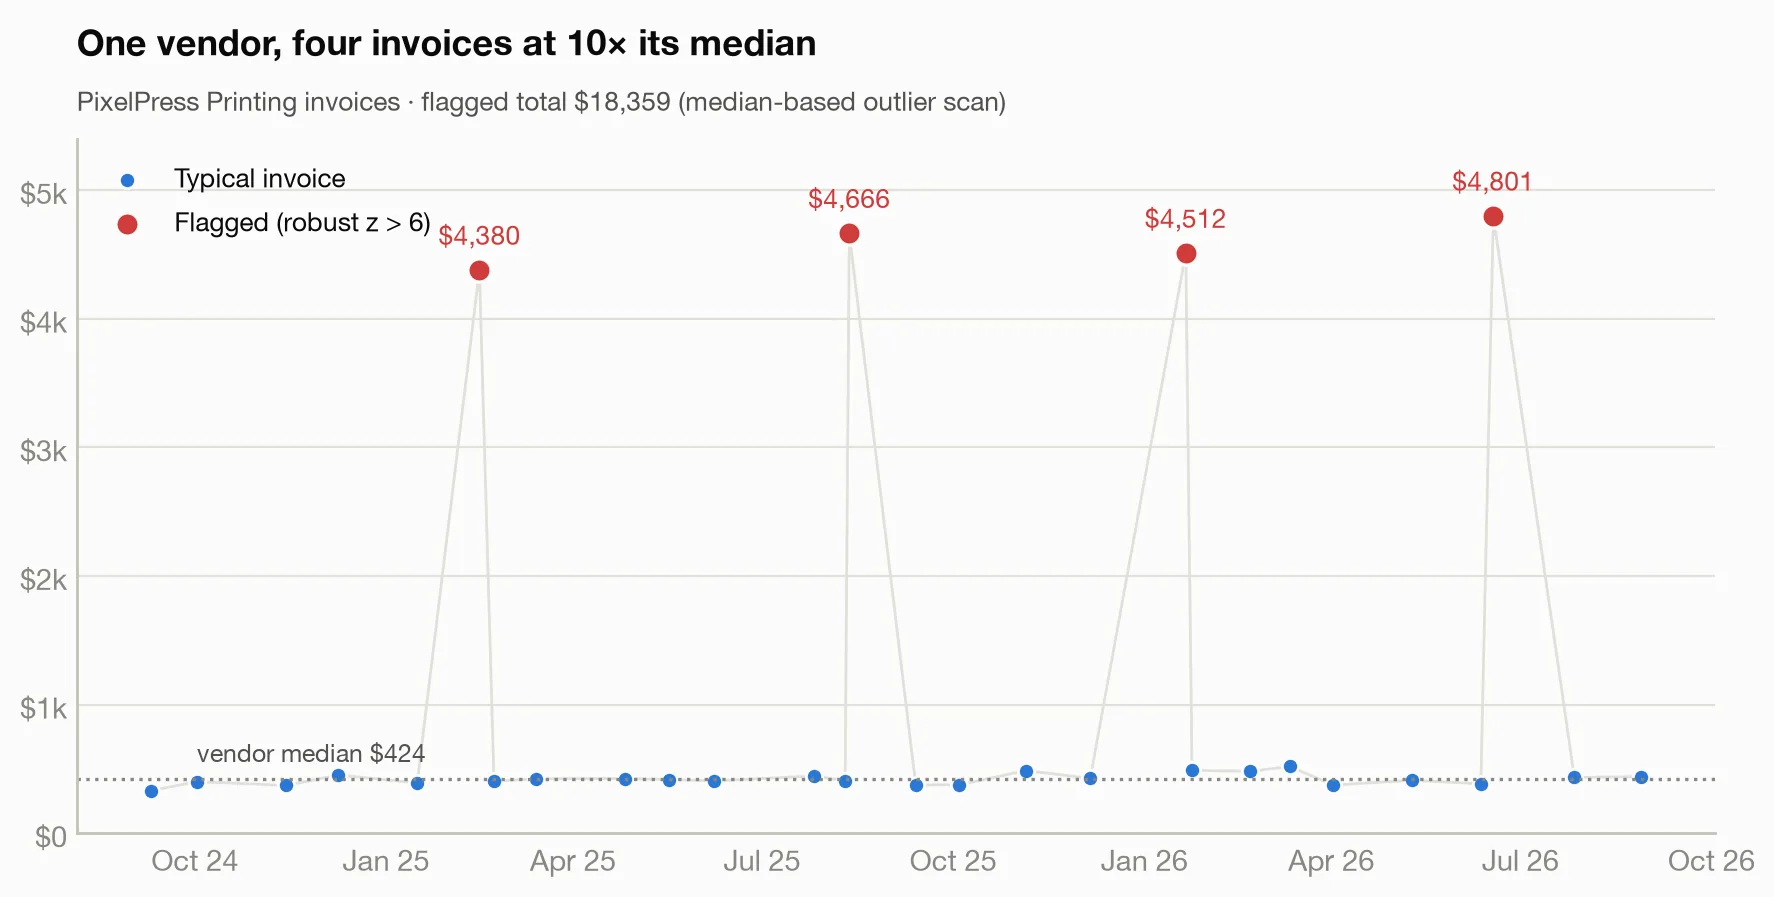
PixelPress Printing: median invoice $424.47, but four invoices between $4,380 and $4,801 — more than ten times normal — totaling $18,359. Excess over four typical invoices: $16,661.12. In real books this pattern is a billing error, a decimal slip, or an unauthorized rush order; any of them deserves a phone call before the next one lands.
Are meals and travel actually creeping, or does it just feel that way?
"It feels like we spend more on food and flights every quarter" is the kind of claim that starts arguments. So I asked for a formal before/after comparison of monthly meals + travel spend, year one vs year two:
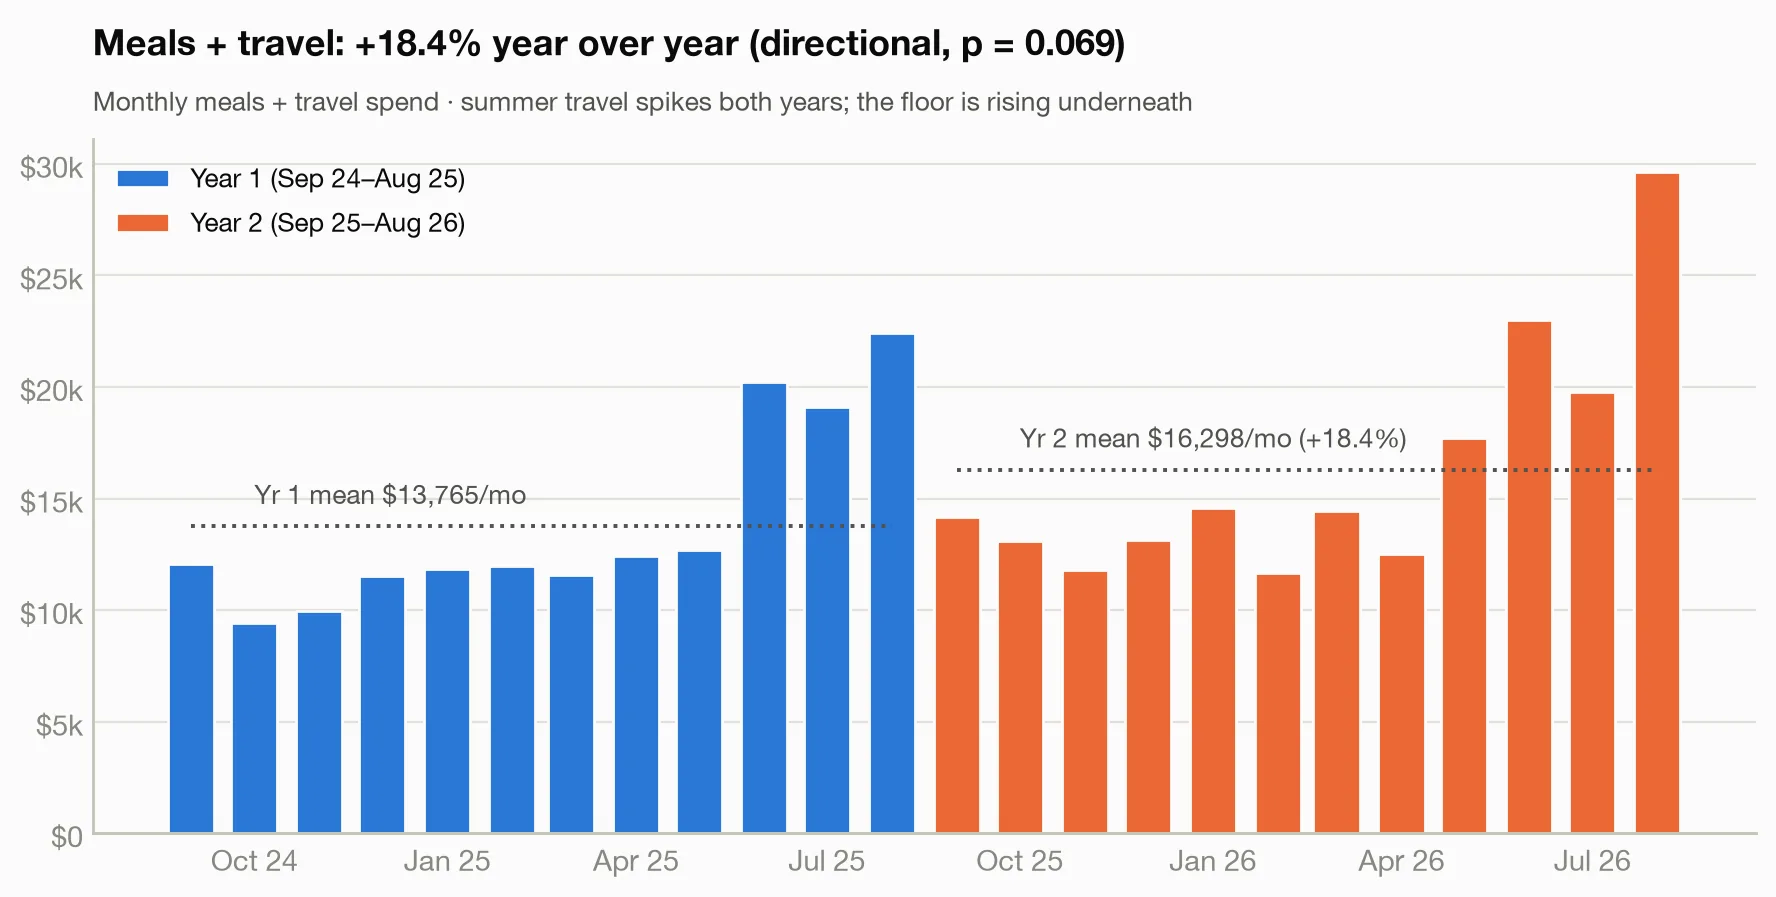
Result: $13,765/month → $16,298/month, up 18.4%. But the tool did not let me oversell it: its check on whether a gap this size could plausibly be luck came back borderline — not strong enough to rule out chance — and the result shipped labeled low trust: "it may well be noise… a before/after comparison, not a causal test." With 12 months per side and summer travel spikes in both years, that's the right call. The honest reading: probably real, worth watching, not yet proof. An LLM freelancing on a spreadsheet would have confidently declared a trend; deterministic tooling declared directional — and that difference is what makes the numbers usable.
What does a small business cash flow forecast look like — honestly?
Revenue in this dataset is roughly flat (about $169k/month), so every dollar of creep comes straight out of the margin. Net cash flow shows it: year-one average $34,416/month, year-two $27,383, last six months $22,353, and August 2026 closed negative (−$1,474).
I asked for a six-month forecast. The tool fit a standard forecasting model (one that projects a series forward from its own history) and returned estimates of roughly $22.6k–$29k/month — with an uncertainty band whose lower edge sits below zero for the entire horizon:
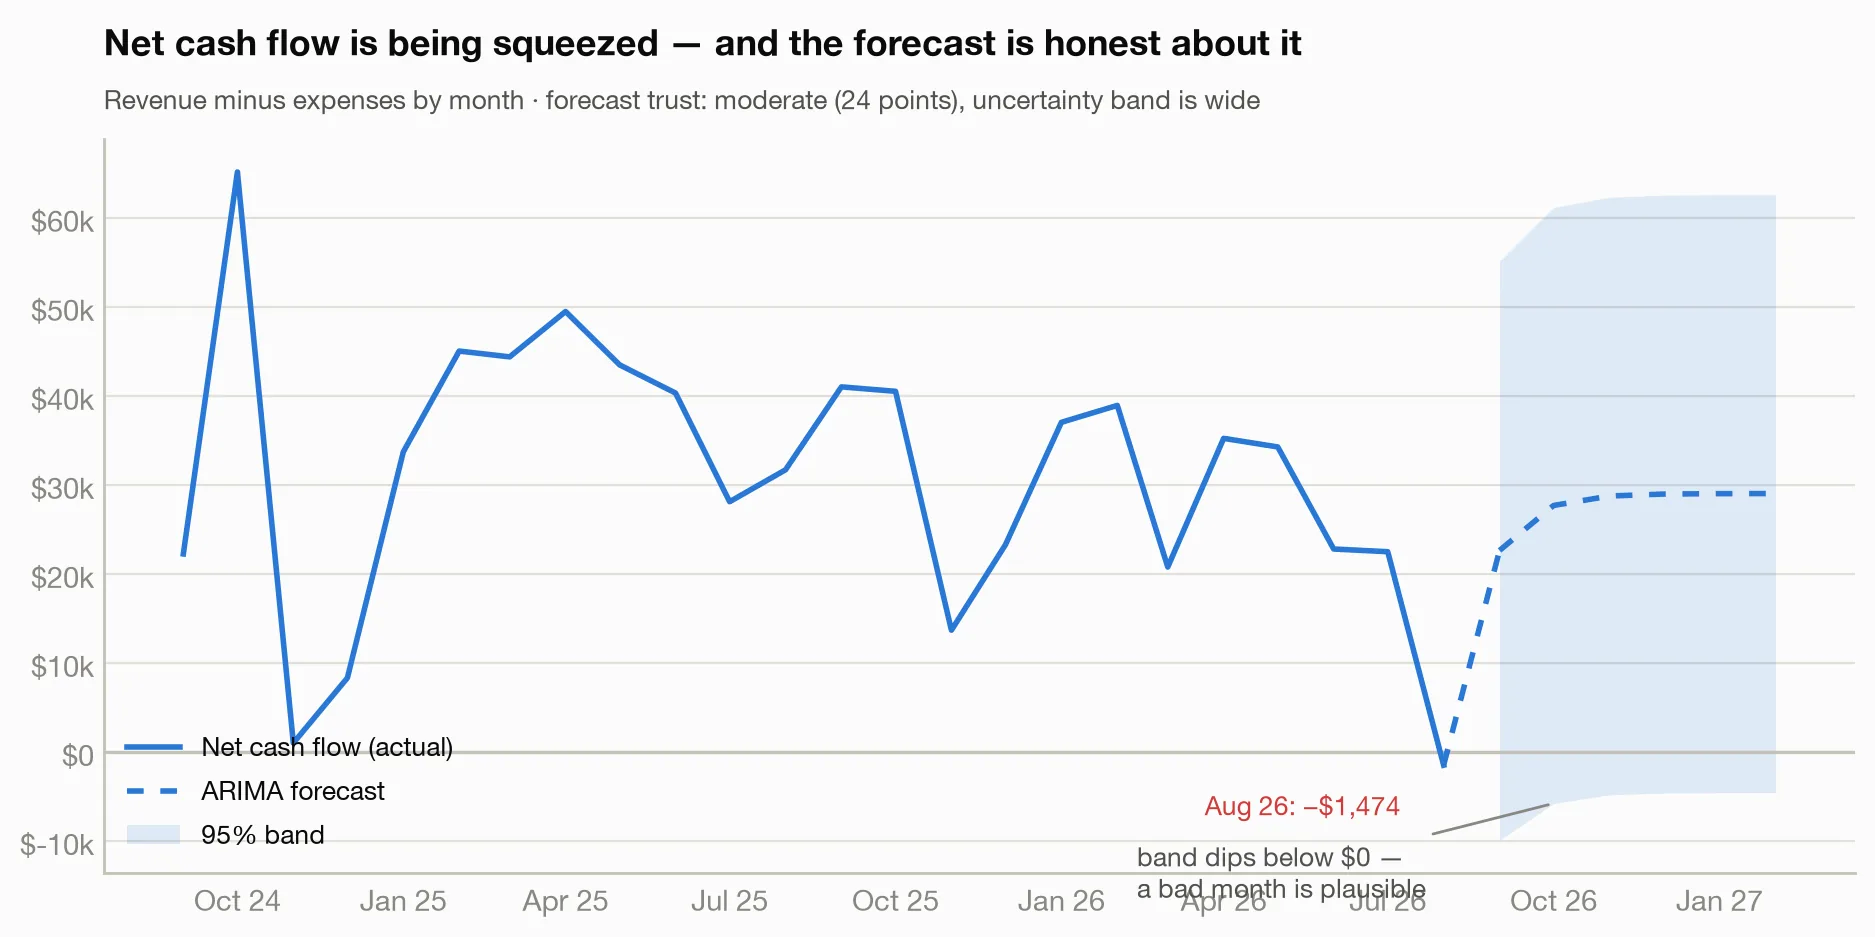
Trust level: moderate, with the caveats that uncertainty grows with distance and the model "assumes the past pattern continues." That wide band isn't a flaw — it is the forecast. With 24 months of history and this volatility, any tool showing you a confident thin line is lying. The actionable read: the base case is fine, a negative month is genuinely plausible, and the trend line the forecast is anchored to has been sinking for a year — which is exactly why the $37k above matters.
Why not just upload my QuickBooks export to ChatGPT or Claude?
The chat window is right there. Three reasons this setup wins.
1. A chatbot re-reads your ledger on every question. A 4,692-row CSV is a few hundred thousand tokens; a chat interface truncates it, samples it, or re-bills it on every follow-up. Here the CSV loaded once into a local database, each question moved a few hundred tokens, and twenty follow-ups cost essentially nothing.
2. One total, every run. Ask a model to sum 4,692 amounts from raw text and it invents a confident wrong total — a different one each time. Every figure here came from real code, matched on rerun, and logged its method. When the data fell short, the tool refused: one hard refusal and three "low trust, treat as directional" warnings this run. That's a feature.
3. Your books stay home. A ledger holds salaries, vendors, margins. The server reads a local folder; the transactions never leave your machine. Only summaries cross the wire — "9 duplicate candidates, $18,002.74" — not thousands of rows.
What's the total, and what would you actually do?
| Finding | Amount |
|---|---|
| Duplicate payments (8 verified incidents) | $18,002.74 |
| Anomalous vendor invoices (excess over typical) | $16,661.12 |
| Vendor price jump (paid above old rate, 5 months) | $2,594.04 |
| Recoverable / questionable total | $37,257.90 |
| Subscription creep (annualized run-rate increase) | $52,052/yr to review |
The to-do list writes itself: request refunds on the duplicates, dispute or explain the four printing invoices, renegotiate (or budget) the CRM hike, and audit 25 SaaS subscriptions down to the ones people actually use. On a business netting ~$27k/month, that's more than a month of profit recovered by asking questions of data that was already sitting in the accounting system.
FAQ
How do you categorize business expenses? Group expenses by what they are for, using categories that match how you will actually use the numbers — rent and utilities, payroll, software and subscriptions, marketing, travel and meals, professional fees, supplies, insurance. Keep the list short enough that categorizing is quick and consistent, since a hundred categories used sloppily is worse than fifteen used properly. Tax rules put some expenses in specific boxes, so it is worth matching your categories to your tax return's lines from the start.
What is a good expense to revenue ratio? Most small businesses run total operating expenses at 60-80% of revenue, leaving a 20-40% operating margin, though the healthy range varies widely by industry. Service businesses with high payroll sit at the top of that range; product businesses with high cost of goods look different again because much of the spend is above the operating expense line. The number to watch is your own ratio over time — a steady creep upwards means costs are growing faster than sales, which is the problem worth catching early.
How do you find wasted business spending? Look in three places: recurring charges for things nobody uses any more, duplicate payments, and suppliers whose prices rose without anyone noticing. Subscriptions are the usual culprit because they renew silently and nobody owns the decision to cancel. A simple review of every vendor you paid more than once in the last year, sorted by total, finds most of it in an hour.
How do you spot duplicate payments? Look for transactions with the same vendor and the same amount within a short window of each other — a few days apart is the classic pattern, from an invoice paid twice by two people or by two methods. Also check for near-identical amounts, since partial payments and currency rounding disguise some duplicates. Each match is a candidate, not a certainty: some are genuine repeat charges, so confirm against the invoice before asking for anything back.
Do this with your own books
The setup takes about 15 minutes: export your data as CSV and follow the instructions in the meelu-analytics-mcp README. Then ask your questions in plain English — start with the ones in this post.
Frequently asked questions
What is the difference between fixed and variable costs?
Fixed costs stay roughly the same whatever your sales volume — rent, insurance, salaries, most software. Variable costs move with volume — materials, shipping, payment processing fees, commissions. The split matters because it tells you your break-even point and how exposed you are to a slow month: a business with mostly fixed costs suffers far more from a revenue dip than one whose costs shrink alongside sales.
How often should you review business expenses?
Monthly for a quick scan and quarterly for a proper review. The monthly pass is mostly about catching errors while they are still recent — duplicates, wrong amounts, charges you do not recognise. The quarterly review is where you look at trends by category, check which suppliers have crept up in price, and cancel what is no longer earning its place. Annual-only reviews find the same problems eleven months later, when the money is long gone.
Can AI analyze business expenses accurately?
Yes for the arithmetic, with judgement still required on the findings. Totals, category breakdowns, duplicate matching, and trend calculations are exact when a real database does the computing rather than a model estimating from rows. What comes with uncertainty is the interpretation — whether a spending trend is real or seasonal noise, and whether a flagged duplicate is actually an error. Treat the output as a review list to check against invoices, and be suspicious of any tool that never expresses doubt.
This post is part of building Meelu, an AI marketing agent that runs locally — site audits, data analysis, outreach, and social listening on your own machine. Join the waitlist to hear when it ships.
Related posts